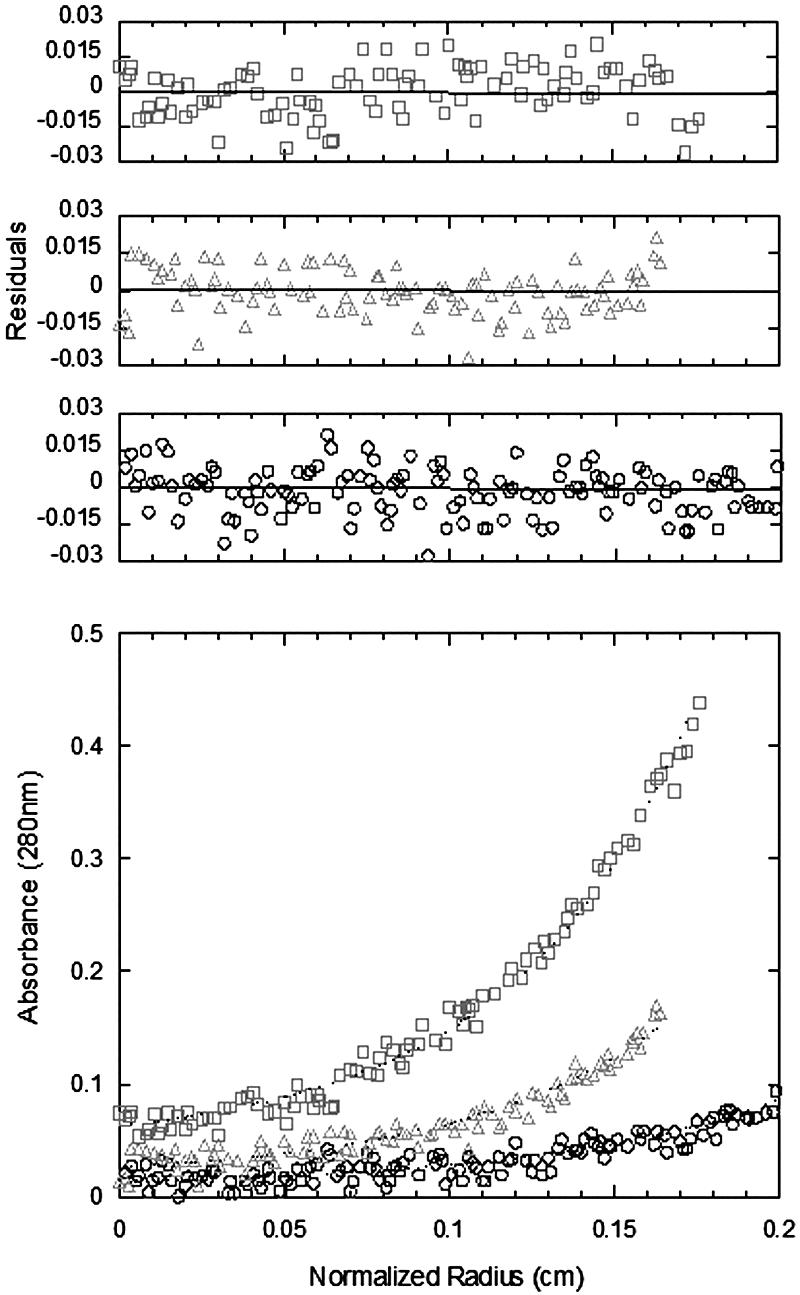
FIG. 2.

Sedimentation equilibrium data for Synechocystis sp. strain 6803 type II IPP isomerase. The lower panel shows experimental data points for three different loading concentrations (□, 2.8 μM; ▵, 1.4 μM; ○, 0.7 μM) of the protein with the corresponding calculated fit (dotted line). The upper panels show the residuals for these fits; all are small and random, indicating a good fit corresponding to a Kd of 0.2 μM.
