
Figure 2.
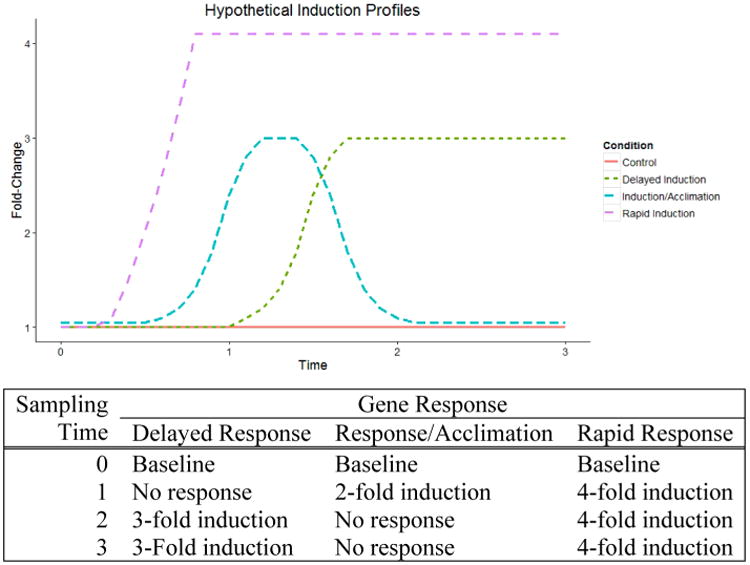
Hypothetical up-regulation (a) and down-regulation (b) profiles for genes expressed over time in response to environmental contaminants. By sampling at time 0 (baseline) and comparing the expression of these genes to post-treatment time points (time 1–3), we determined that it is clear that some gene response and time points will result in variable ability to detect biological response (c).