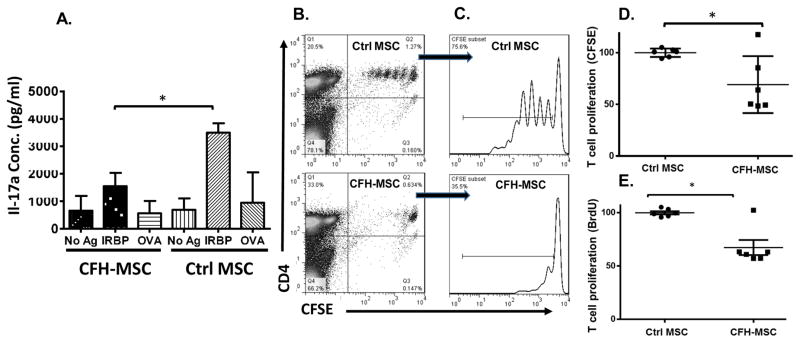
Figure 8. Painting CFH onto MSCs improves their viability and function in vivo.
(A) Naïve WT mice were injected with 5×10⁶ in vitro propagated IRBP1–20-specific Th17 cells via the tail vein injection, then half received 0.5 ×10⁶ MSCs painted with 10 μg/ml of CFH (CFH- MSC) and the other half the same number of mock-painted MSCs (Ctrl MSCs). After 7 days, the spleens were collected and 1×10⁶ splenocytes from each mouse incubated for 72 h in the presence of 20 μg/ml of IRBP1–20 (IRBP), 20 μg/ml of irrelevant OVA323–339 peptide (OVA), or no peptide (no Ag), then IRBP1–20-specific Th17 responses were assessed by measuring IL-17 in the culture supernatants using conventional ELISA. The results are the mean± SD, n=4 in each group, One-way ANOVA and Tukey post-hoc tests were used for data analysis, *p<0.05 comparing the indicated groups. (B–D) Naïve WT mice were injected with 4×10⁶ CFSE-labeled OT II T cells via the tail vein, then, after 24 h, syngeneic bone marrow-derived DCs loaded with 1 μg/ml of OVA (0.4 × 10⁶/mouse) were injected s.c. into the hind footpads and CFH-painted MSCs (CFH-MSC) or mock-painted MSCs (Ctrl MSC) (1×10⁶/mouse) were injected via the tail vein. After another 24 h, 1 mg of BrdU was injected i.p. into each mouse, then, 24 h later, the draining lymph nodes (popliteal lymph nodes) were harvested and T cells proliferation quantified by measuring CFSE dilution and flow cytometry and by measuring incorporated BrdU using a BrdU ELISA. Representative T cell proliferation results based on CFSE-dilution measurements from Ctrl-MSC or CFH-MSC treated mice are presented in dot plot (B) and histogram (C). T cell proliferation assessments based on CFSE-dilution measurements (D) and BrdU incorporation (E) results from three different experiments were normalized against the average value from the Ctrl MSC-treated mice (as 100%) in each experiment and combined. n=6 in each group, mean ± SEM, multiple t-test was used for data analysis, *p<0.05

