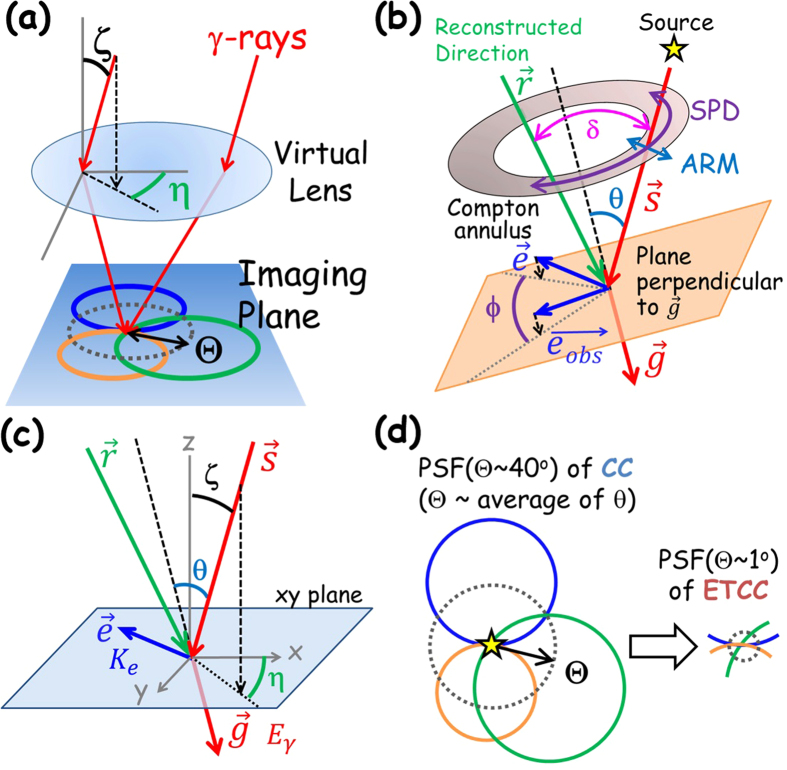
Figure 1. Schematic explanations of gamma-ray reconstruction, the PSF and coordinates systems.
(a) Schematic diagram of the PSFs of the CC and ETCC on the imaging plane (laboratory coordinates). An image of a point source is displayed with event circles reconstructed in CC. Here ζ and η denote two angles of an incident gamma. (b) Schematic explanation of the Compton scattering kinematics. The parameters θ and ϕ denote the Compton-scattering angle and electron-azimuthal angles of the incident gamma, respectively, on the Compton coordinates. (c) Coordinate diagram for explanation of the angles of ζ, η, and θ in the laboratory coordinates x-y-z. (d) Schematic explanation of PSF(Θ) of the CC and ETCC. See text for the definition of Θ.

