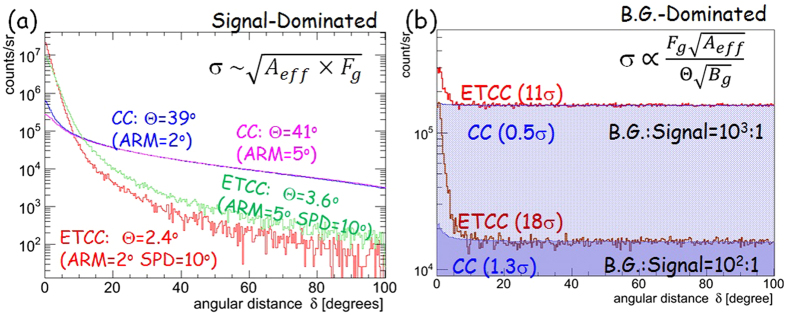
Figure 3. Comparisons of simulated PSFs between CC and ETCC analyses.
(a) Simulated distributions of the event density per unit solid angle as a function of the angular distance δ for a point source in a signal-dominated case with the CC and ETCC analyses with the improved 30-cm-cubic ETCC (ARM = 2° or 5°, and SPD = 10° at 662 keV) (b) Same as (a) but in background-dominated cases with the background-to-signal ratios of 102 and 103.

