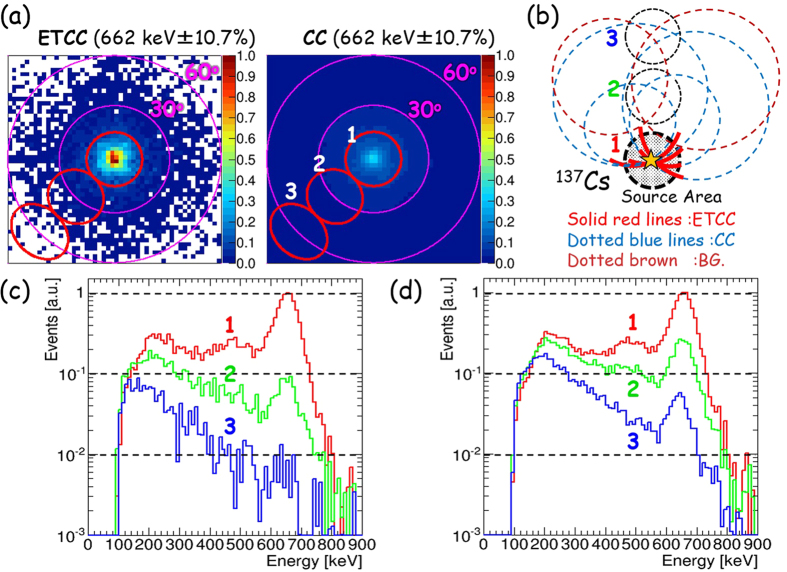
Figure 4. Comparison of measured images and event leakages in CC and ETCC analyses.
(a) Measured images of 662 keV point source (137Cs: 0.86 MBq) placed at a distance of 2 m with the ETCC analysis (left panel) and CC analysis (right). The colour-bars in both the panels indicate the ratio of the event density to the maximum value in the ETCC analysis. The red circles (labelled the numbers of 1, 2 and 3) are 15°-radius regions for the spectra indicated in panels (c) and (d). (b) A schematic drawing to illustrate the difference of the outward leakage of events in the PSF between the ETCC and CC analyses. (c and d) Energy spectra calculated with the (c) ETCC and (d) CC analyses, after the gammas for each spectrum are accumulated from a circular region with a radius of 15°, located at the angular distances of 0° (red, labelled 1), 30° (green, labelled 2), and 60° (blue, labelled 3) from the centre of each region to the source position. In each spectrum, the measured events are normalized to the maximum number of events at 662 keV at the centre of FoV.

