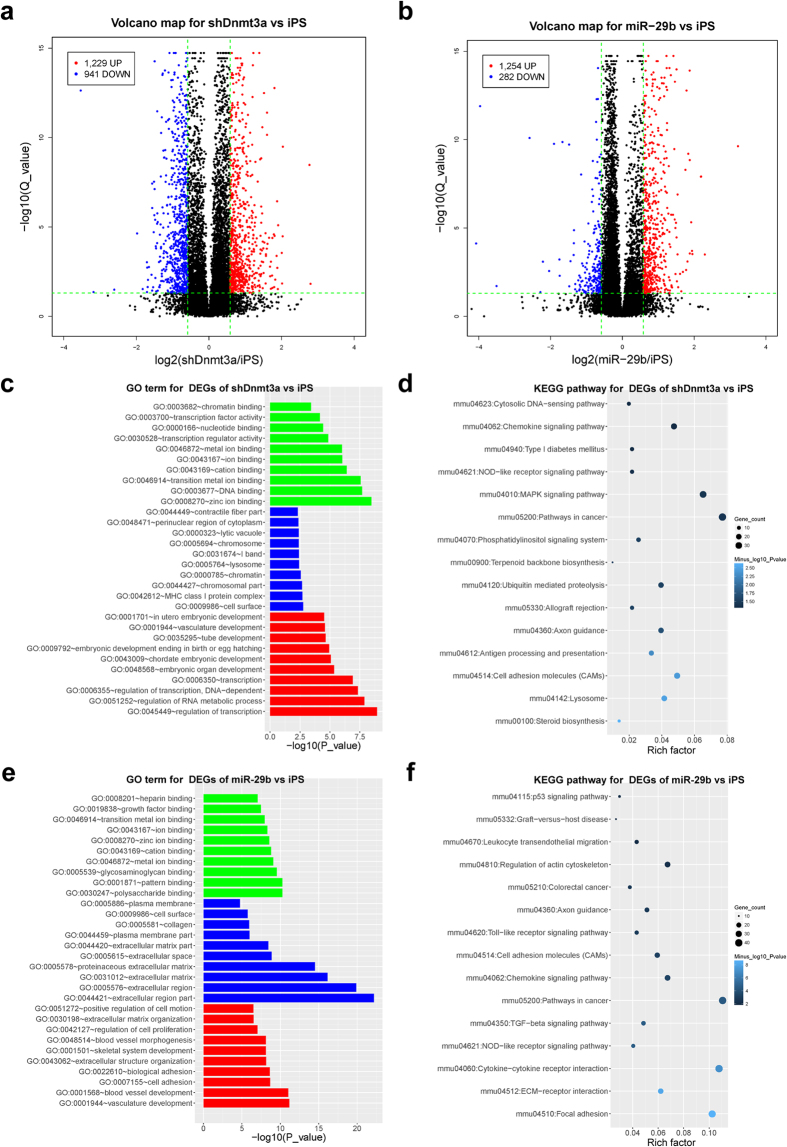
Figure 2. Demethylation during somatic cell reprogramming improves the quality of iPSCs.
(a) A volcano plot of the DEGs between OSKM + shDnmt3a-iPSC and OSKM-iPSC; the x-axes index the log2(fold-change), and the y-axes index the –log(Q_value). (b) A volcano plot for DEGs between OSKM + miR-29b-iPSC and OSKM-iPSC. (c) GO analysis of DEG enrichment between OSKM + shDnmt3a-iPSC and OSKM-iPSC (colors: green for mf, blue for cc, red for bp). (d) KEGG pathway analysis of DEG enrichment between OSKM-shDnmt3a-iPSC and OSKM-iPSC. (e) GO analysis of DEG enrichment between OSKM + miR-29b-iPSC and OSKM-iPSC (colors: green for mf, blue for cc, red for bp). (f) KEGG pathway analysis of DEG enrichment between OSKM + miR-29b-iPSC and OSKM-iPSC. iPSC, OSKM-iPSC; miR-29b, OSKM + miR-29b-iPSC; shDnmt3a, OSKM + shDnmt3a-iPSC.

