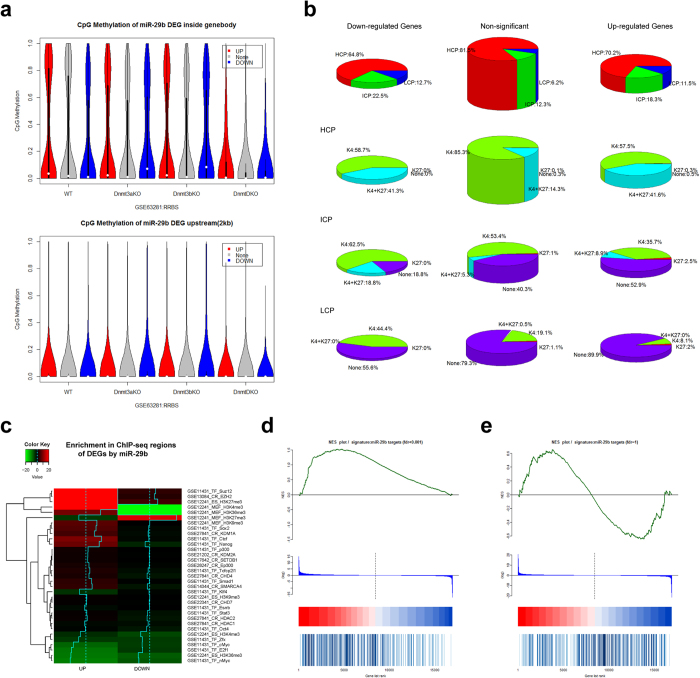
Figure 4. Further analyses for methylation status and promoter characteristics of DEGs between OSKM + miR-29b-iPSC and OSKM-iPSC.
(a) A vioplot of the distribution of CpG methylation upstream and within the gene body among DEGs induced by miR-29b. WT, wild-type ES cells; Dnmt3aKO, knockout of Dnmt3a; Dnmt3bKO, knockout of Dnmt3b; DnmtDKO, double knockout of Dnmt3a/3b. (b) A pie plot of the distribution of promoter characteristics (including the CpG density group as well as K4 and K27 signals) among DEGs induced by miR-29b. (c) A heatmap of DEG enrichment by miR-29b on ChIP-Seq regions. (d) A GSEA plot of miR-29b targets (log2(fold-change)) between miR-29b and iPSCs. (e) A GSEA plot of miR-29b targets (log2(fold-change)) between shDnmt3a and iPSCs.

