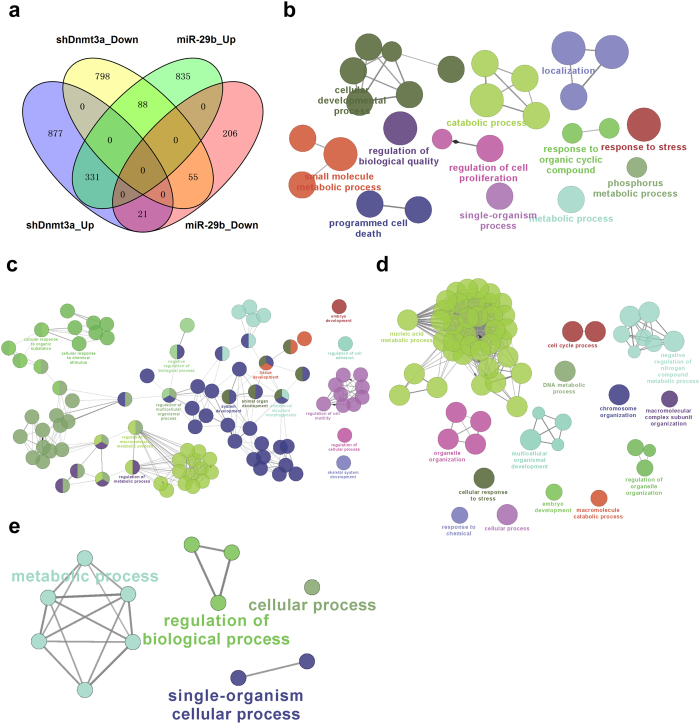
Figure 5. Further analyses of specific DEGs regulated by shDnmt3a and miR-29b.
(a) A Venn diagram of the distribution of DEGs induced by both shDnmt3a and miR-29b. (b) A ClueGO plot (cytoscape app) in GO_BP for only genes up-regulated by shDnmt3a. (c) A ClueGO plot (cytoscape app) in GO_BP for only genes up-regulated by miR-29b. (d) A ClueGO plot (cytoscape app) in GO_BP for only genes down-regulated by shDnmt3a. (e) A ClueGO plot (cytoscape app) in GO_BP for only genes down-regulated by miR-29b. miR-29b, OSKM + miR-29b-iPSC; shDnmt3a, OSKM + shDnmt3a-iPSC.

