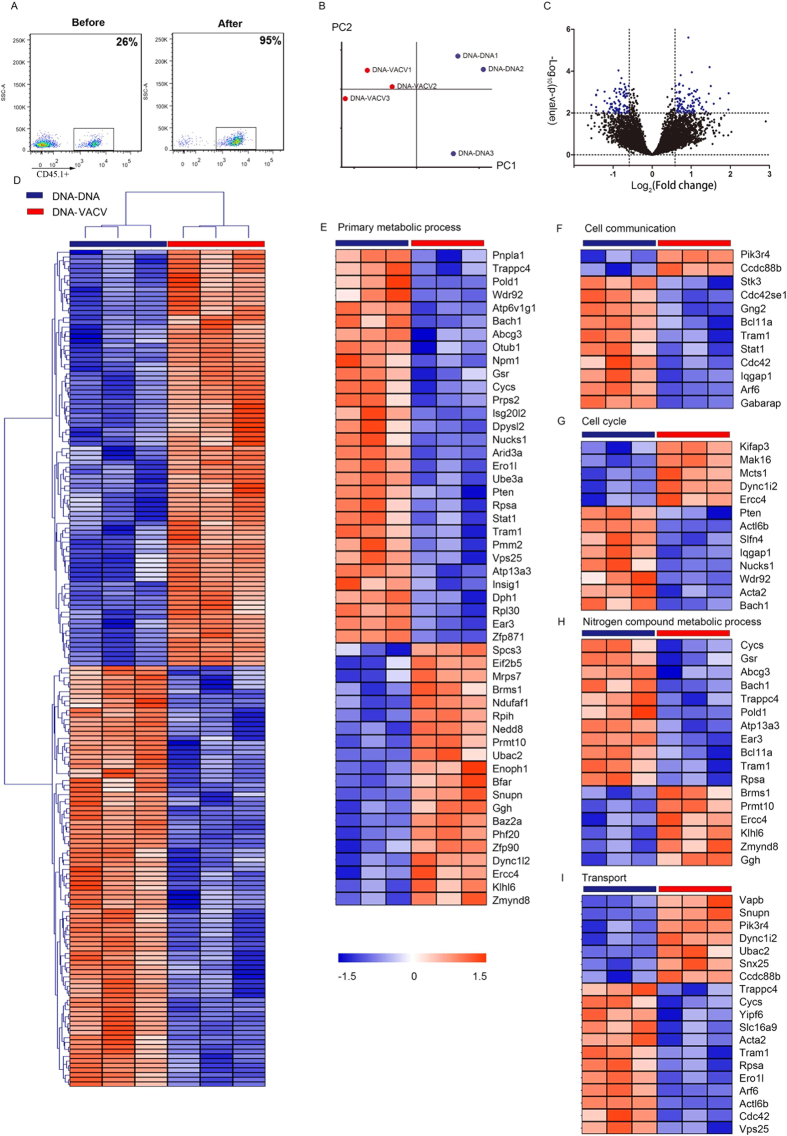
Figure 4. Gene expression profiles of antigen-specific CD8+ T cells induced by DNA-DNA and DNA-VACV regimen.
(A) The purity of CD45.1-PE based cell sorting; (B) The PCA plot and (C) Volcano plot of gene profiles from DNA-DNA and DNA-VACV groups. (D) Supervised hierarchical cluster analysis of differentially expressed genes between cells from DNA-DNA and DNA-VACV groups. Hierarchical cluster analysis of differentially expressed genes involved in primary metabolic process (E), cell communication (F), cell cycle (G), nitrogen compound metabolic process (H) and transport (I).

