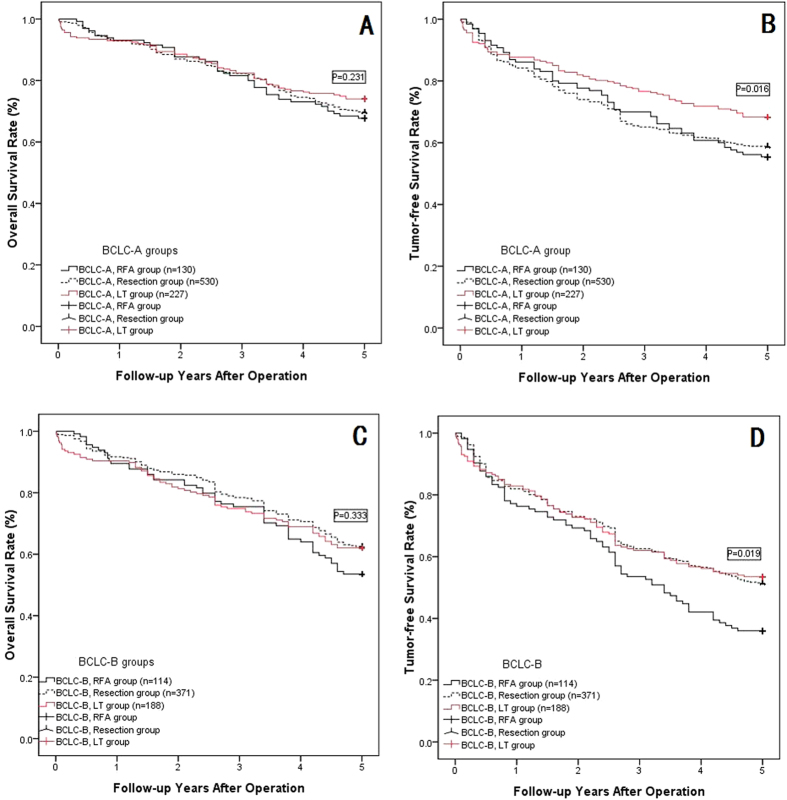
Figure 6. The OSR and TFSR comparison among RFA group, Resection group and LT group for BCLC-A or B HCC patients.
(A) The OSR comparison among three groups: BCLC-A HCC patients accepted RFA group, Resection group or LT group showed no significantly OSR (P = 0.231); (B) The TFSR comparison among three groups: BCLC-A HCC patients accepted LT showed significantly higher TFSR than RFA group and Resection group (P = 0.016); (C) The OSR comparison among three groups: BCLC-B HCC patients accepted RFA group, Resection group or LT group showed no significantly OSR (P = 0.333); (D) The TFSR comparison among three groups: BCLC-B HCC patients accepted LT or Resection showed significantly higher TFSR than RFA group (P = 0.019).

