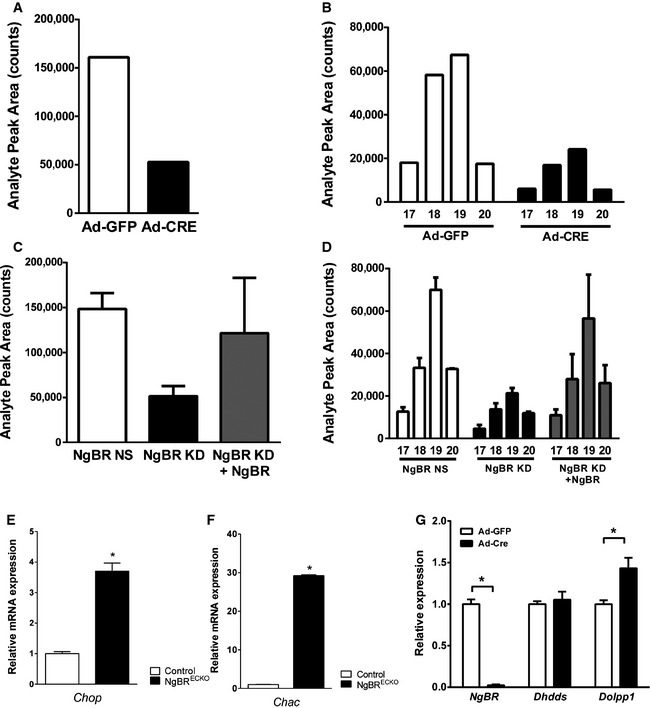
Figure EV3. Dolichol level measurement and gene expression analysis in NgBR‐depleted tissues and cells.

-
A, BTotal dolichol levels (A) and distribution of dolichol‐17, 18, 19, and 20 (B) measured from primary MLEC treated with Ad‐GFP or Ad‐Cre.
-
C, DTotal dolichol levels (C) and distribution of dolichol‐17, 18, 19, and 20 (D) measured from HeLa cells with stable knockdown of NgBR by shRNA (NgBR KD), control (NgBR NS), and pcDNA‐NgBR‐transfected NgBR KD cells showing conservation of the role of NgBR. Analysis of dolichol species by liquid chromatography and mass spectroscopy was performed as described in 4.
-
EmRNA expression levels of Chop in the NgBRECKO yolk sac detected by qPCR.
-
GmRNA expression levels of Chac in the NgBRECKO yolk sac detected by qPCR.
-
HPrimary MLEC were treated with Ad‐GFP or Ad‐Cre, and mRNA expression levels were determined after 5 days of infection by qPCR. In Ad‐Cre‐infected cells, almost no NgBR mRNA expression was detected. Dolpp1 mRNA expression was upregulated in NgBR‐deleted MLEC.
Data information: *P < 0.05. P‐values were calculated by unpaired Student's t‐test. Data are mean ± SEM from 3–5 independent experiments.
