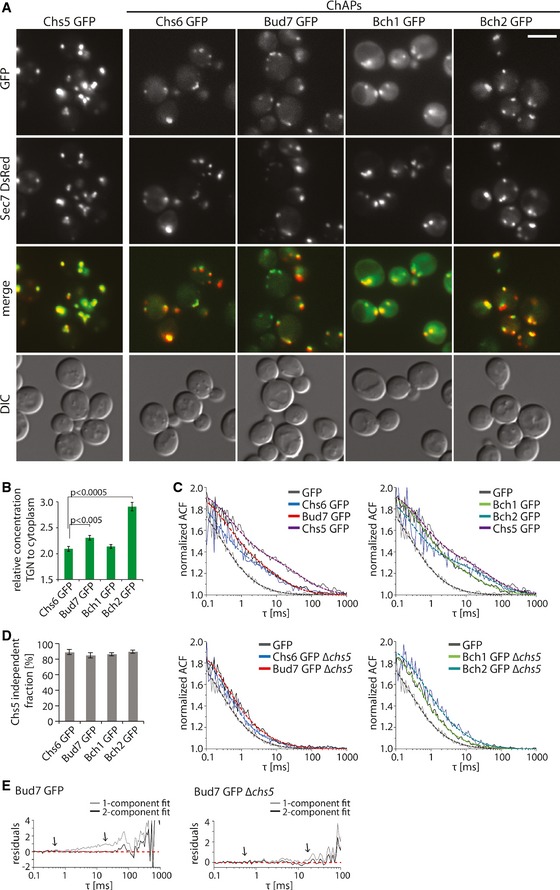
Figure 1. Exomer assembles from its subunits on the trans‐Golgi network (TGN).

- Exomer components localize to different extent to the TGN and to the cytoplasm. Fluorescence images of cells expressing GFP‐tagged exomer components and TGN marker Sec7‐DsRed. The brightness and contrast were adjusted differently in the GFP and merge images. Scale bar, 5 μm.
- Quantification of the relative TGN to cytoplasm concentration of the GFP‐tagged ChAPs in the cell. The mean fluorescence at the TGN and cytoplasm was determined using the Icy imaging software. 20–30 individual cells were analyzed. Error bars represent SD. For statistical significance testing, Student's t‐test was used.
- FCS measures the in vivo mobility of exomer components in the cytoplasm. FCS analysis was performed on the GFP, Chs5‐GFP, and GFP‐tagged ChAPs in the wild‐type background (top) and on GFP‐tagged ChAPs in the Δchs5 background (bottom). 10–20 FCS measurements were performed for each condition using different cells. The ACF of free GFP is fitted with a one‐component anomalous diffusion model. The ACF of Chs5 in WT and ChAPs in WT and Δchs5 background is fitted with a two‐component diffusion model. Representative ACF curves (thin full lines) and fits (thick dashed lines) are shown. Estimated diffusion correlation times, diffusion coefficients, and fractions are shown in Table 1.
- Quantification of the Chs5 independent fraction of ChAPs present in the cytoplasm based on the measurements shown in (C). Error bars represent SD.
- Comparison of the residuals of the one‐component and two‐component fit (arrows).
