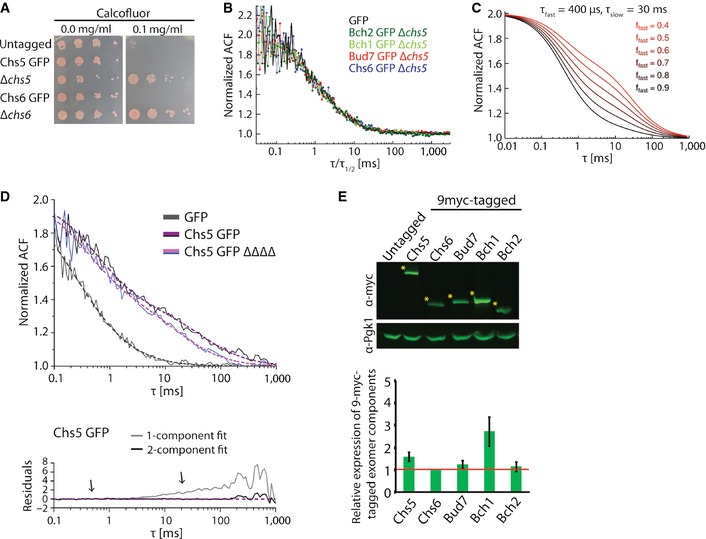
Figure EV1. Characterization of Chs5 and the ChAPs fusion proteins.

- GFP‐tag does not affect functionality of the GFP‐tagged exomer components. Chs5‐GFP‐ and Chs6‐GFP‐expressing strains were sensitive to calcofluor similarly as the WT strain. Plates were incubated at 30°C for 2–3 days.
- Comparison of the ACFs for GFP and ChAPs in the ∆chs5 strain rescaled by their respective half times.
- Simulated FCS traces of the fast and slow component with fixed diffusion correlation times (τfast, τslow) and variable fast component fractions (ffast).
- FCS measures the in vivo mobility of Chs5 complexes in the cytoplasm. FCS analysis was performed on the GFP and Chs5‐GFP in the presence or absence (ΔΔΔΔ) of the ChAPs. 10–20 FCS measurements were performed for each condition using different cells and representative curves are shown. The ACF of free GFP is fitted with a one‐component anomalous diffusion model. The ACF of Chs5‐GFP in both WT and ΔΔΔΔ background was fitted with a two‐component diffusion model. The residuals assess the quality of the fit. Note the ChAP deletion affects the diffusion of the slow component of Chs5 only mildly. Estimated diffusion correlation times, diffusion coefficients, and fractions are shown in Table 1.
- Quantification of the relative expression levels of the exomer components in 9‐myc‐tagged strains. Representative immunoblot of yeast lysates is shown; Pgk1 serves as a loading control. The asterisks depict the analyzed bands. The plot shows average and SD of three independent biological experiments. The relative expression levels are normalized to Chs6 (depicted by the red line).
