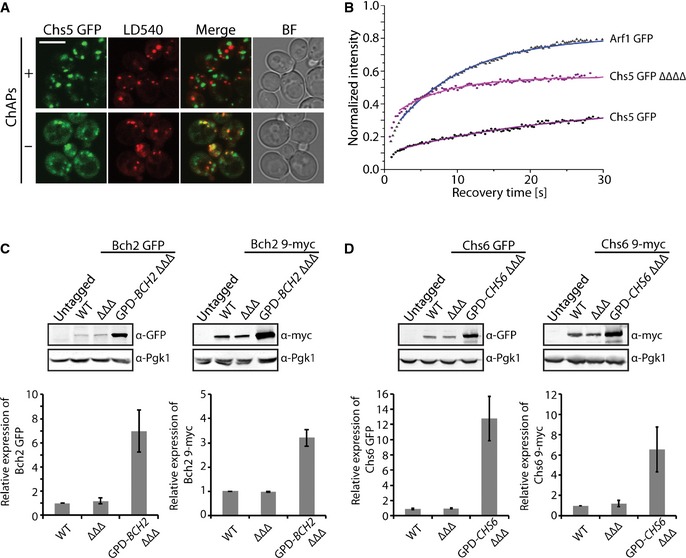
Figure EV3. Analysis of Chs5‐GFP and ChAPs expression levels.

- In the absence of ChAPs, Chs5‐GFP localizes to the trans‐Golgi network, cytoplasm, and lipid droplets. Confocal images of strains expressing Chs5‐GFP with and without the ChAPs, stained with a lipid droplet staining dye LD540. Scale bar, 5 µm.
- Binding kinetics of Arf1‐GFP in the WT and Chs5‐GFP in the WT and ΔΔΔΔ strains. The mean of 20–30 FRAP measurements from different cells is shown. Calculated parameters are shown in Table 2.
- Quantification of the relative expression levels of the GFP‐ and 9‐myc‐tagged Bch2 in WT, BCH2 ΔΔΔ, and GPD‐BCH2 ΔΔΔ strains. Representative immunoblots of yeast lysates are shown; Pgk1 serves as a loading control. The plots show average and SD of three independent biological experiments. The relative expression levels are normalized to WT.
- Quantification of the relative expression levels of the GFP‐ and 9‐myc‐tagged Chs6 in WT, CHS6 ΔΔΔ, and GPD‐CHS6 ΔΔΔ strains. Representative immunoblots of yeast lysates are shown; Pgk1 serves as a loading control. The plots show average and SD of three independent biological experiments. The relative expression levels are normalized to WT.
