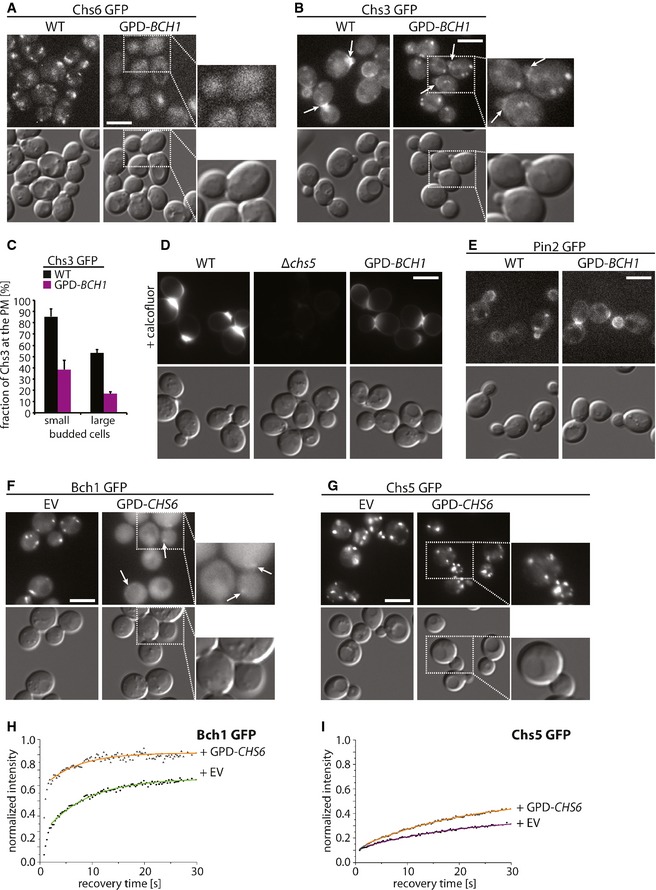
Figure 7. The relative expression levels of ChAPs are set to fine‐tune the exomer assembly pathway.

-
A, BOverexpression of Bch1 displaces Chs6 from the trans‐Golgi network (TGN) and impairs plasma membrane localization of Chs6‐dependent cargo Chs3. Fluorescence images of Chs6‐GFP (A) and Chs3‐GFP (B) in WT and GPD‐BCH1 strains. Scale bars, 5 μm. Arrows point to Chs3‐GFP signals at the bud neck. The inset represents a twofold magnification.
-
CQuantification of the phenotypes in (B); 100 small‐budded and 100 large‐budded cells were quantified per experiment. Average and SD of three independent biological experiments are shown.
-
DChitin production is reduced upon Bch1 overexpression. Fluorescence images of chitin stained with calcofluor in Chs3‐GFP WT, Δchs5, and GPD‐BCH1 strains. Scale bar, 5 μm.
-
EOverexpression of Bch1 does not impair plasma membrane localization of the Bch1‐dependent cargo Pin2. Fluorescence images of Pin2‐GFP in WT and GPD‐BCH1 strains. Scale bar, 5 μm.
-
F–IOverexpression of Chs6 displaces Bch1 and Chs5 from the TGN. Fluorescence images (F–G) and binding kinetics at the TGN (H–I) of cells expressing Bch1‐GFP (F, H) and Chs5‐GFP (G, I) upon overexpression of Chs6 under GPD promoter from 2μ plasmid. The insets in (F, G) represent two‐fold magnifications. The arrows in (F) point to residual Bch1 staining at the TGN. The mean of 20–30 FRAP measurements from different cells is shown. Calculated parameters are shown in Table 2. Scale bars represent 5 μm.
