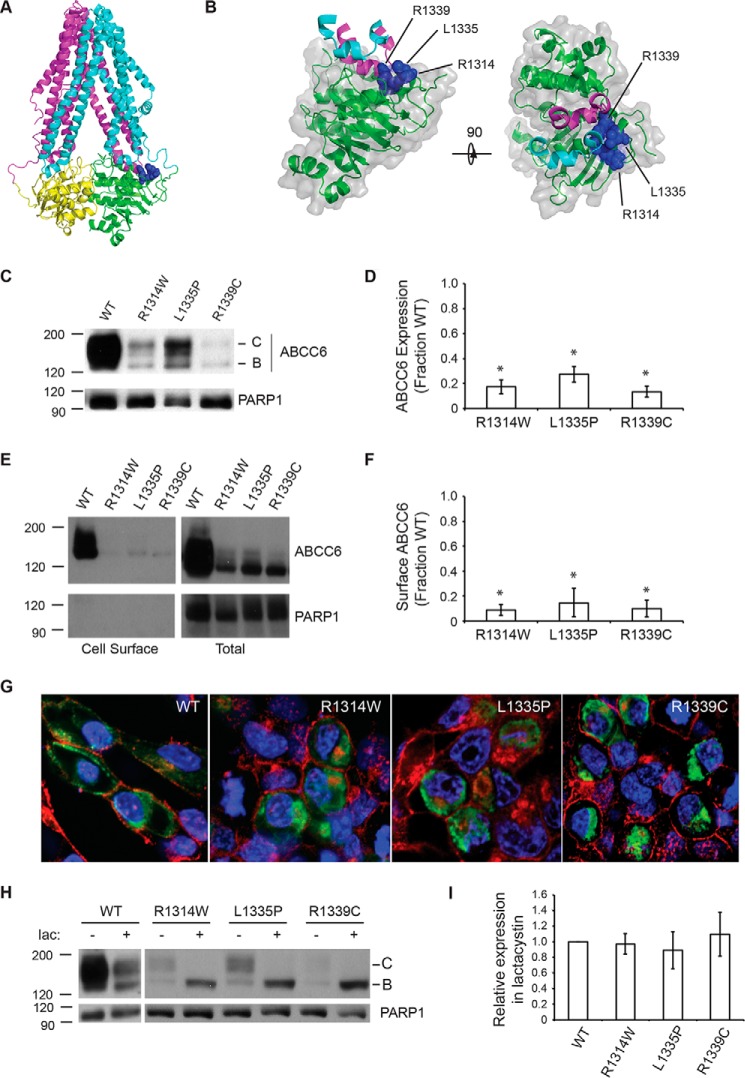
FIGURE 1.
ABCC6 biosynthesis and trafficking. The NBD2 mutations, R1314W, L1335P, and R1339C, were assessed for their impacts on ABCC6 structure and biosynthesis. A, a schematic representation of an ABCC6 homology model is shown. The core TMDs are colored cyan and magenta, and the NBDs are colored green and yellow. The Arg-1314, Leu-1335, and Arg-1339 side chains are shown as blue spheres. B, a schematic and surface representation of NBD2 and the contacting intracellular loops is shown. Intracellular loop four, from TMD1, is shown in cyan, and ICL5 (intracellular loop 5) from TMD2 is shown in magenta. The surface of NBD2 associated with the Arg-1314, Leu-1335, and Arg-1339 residues is shown in blue. C, a representative Western blot of HEK293 cells expressing the wild type, R1314W, L1335P, and R1339C mutants is shown. D, densitometric analysis of Western blots of steady state ABCC6 is shown. E, representative Western blotting after cell surface biotinylation is shown. F, densitometric analysis of cell surface resident ABCC6 is shown. G, representative confocal immunofluorescence images of HEK293 cells expressing the wild type and mutant ABCC6 proteins are shown. ABCC6 is stained in green, WGA is shown in red, and DAPI is shown in blue. H, a representative Western blot of HEK293 cells expressing ABCC6 in the presence and absence of lactacystin is shown. I, densitometric analysis of Western blots of ABCC6 after lactacystin treatment is shown normalized to the expression of wildtype ABCC6. Western blots and immunofluorescence images are representative of n ≥ 4 independent experiments. The identities of band B and C are indicated in C and H. PARP1 is shown as a loading control in C, E, and F. Data shown are summary or representative of n ≥ 3 independent experiments. Quantified data are mean ± S.D. *, p < 0.01 using ANOVA with Tukey's post hoc test.

