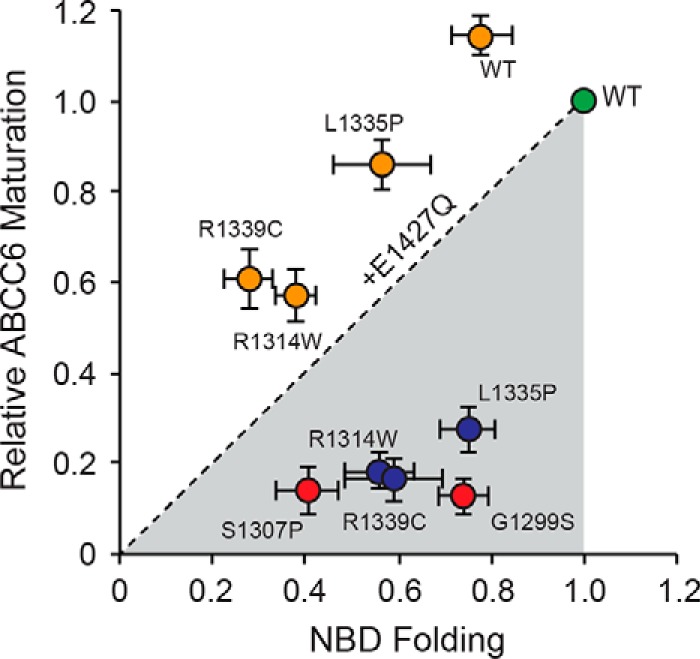
FIGURE 5.

Relationship between NBD and full-length ABCC6 folding. The impact of the NBD2 mutations on the production of full-length and soluble NBD2 proteins is shown. NBD2 folding, measured as a function of soluble NBD2 production is plotted along the x axis. Full-length ABCC6 protein production, measured as the relative quantity of band C, fully glycosylated protein, is plotted on the y axis. Values for both are normalized against the wild type signal, green. The R1314W, L1335P, and R1339C single mutants are shown in red; the E1427Q variant proteins are shown in orange. The dashed line represents the unity relationship between NBD folding and ABCC6 maturation.
