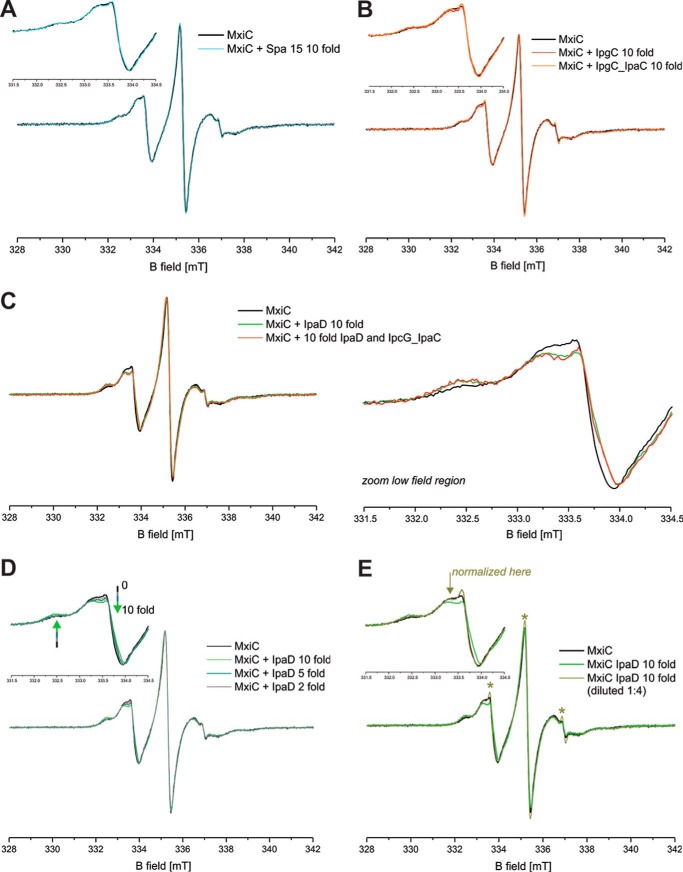
FIGURE 7.
Continuous wave EPR detects a weak but specific interaction of MxiC with IpaD. A, cw EPR spectrum of spin-labeled MxiC in the absence (black) and in the presence of 10-fold excess of Spa15 (cyan). B, cw EPR spectrum of spin-labeled MxiC in the absence (black) and in the presence of 10-fold excess of IpgC (red) or IpgC-IpaC (orange). C, left, cw EPR spectrum of spin-labeled MxiC in the absence (black) and in the presence of 10-fold excess of IpaD (green) or IpaD-IpagC-IpaC (red). Right, the magnified low field region of the spectra (331.5–334.5 mT) highlights the detectable spectral differences. D, cw EPR spectrum of spin-labeled MxiC in the absence (black) and in the presence of n-fold excess of IpaD (indicated in legend). E, cw EPR spectrum of spin-labeled MxiC in the absence (black) and in the presence of 10-fold excess of IpaD (green) and after 1:4 dilution (olive green). The inset shows the magnified low field region of the spectra (331.5–334.5 mT), which highlights the fact that upon dilution the spectrum reverts to that of MxiC alone (except for a small fraction of free label, see asterisks), indicating that complex formation can be detected only at high protein concentrations due to the low affinity. The normalization of the spectral intensity of the diluted sample was done where indicated by the arrow to remove the effect of the free label. Except where otherwise stated, the spectra are normalized to the maximum amplitude of the central EPR line. The insets show the magnified low field region of the spectra (331.5–334.5 mT) to highlight possible spectral differences. The asterisks highlight the minor fraction of label, which is released during the incubation with some protein complexes and/or upon dilution.

