FIGURE 1.

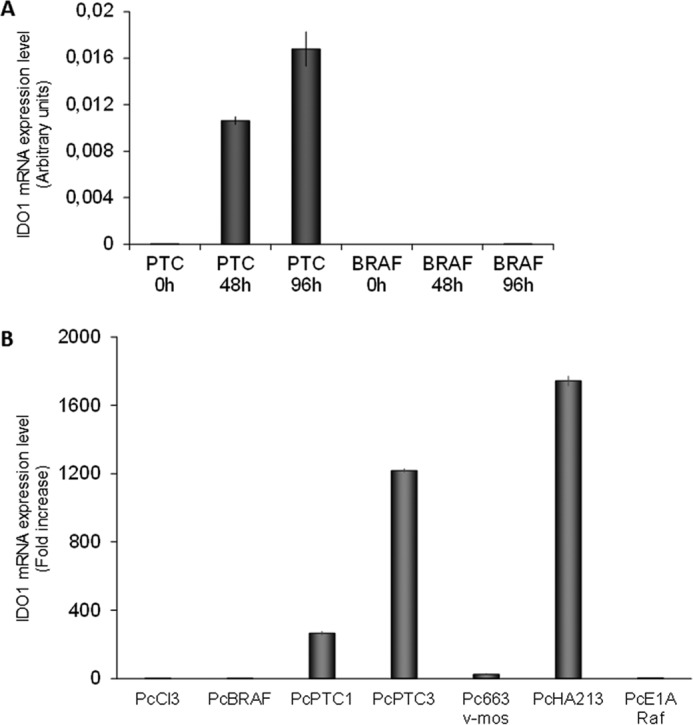
IDO1 expression in PcCL3 cells expressing BRAFV600E or RET/PTC3 oncogenes. A, PTC3–5 cells and BRAF9.6 were incubated with Dox (1 μg/ml) for the indicated times and harvested for total RNA extraction. After total RNA extraction and cDNA synthesis, IDO1 mRNA expression levels were assayed by quantitative PCR. The data are presented as means of arbitrary units. In BRAF9.6 cells Dox treatment for 48 and 96 h did not elicit any up-regulation of IDO1 mRNA expression. Conversely, in PTC3–5 cells induction of RET/PTC3 for the same time was associated with a significant increase of IDO1 mRNA expression. The experiment was repeated three times in triplicate and the more representative result is depicted. B, PcCL3-derived cell lines stably expressing, respectively, BRAFV600E (PcBRAF), RET/PTC1 (PcPTC1), RET/PTC3 (PcPTC3), v-Mos (Pc663), RET/PTC1 and H-RasG12V (PcHA213), and v-Raf (PcE1ARaf) oncogenes were harvested for total RNA extraction. After total RNA extraction and cDNA synthesis, IDO1 mRNA expression levels were assayed by quantitative PCR. Cells expressing RET/PTC1 and RET/PTC3 showed very high IDO1 expression levels compared with PcCL3 cells, whereas mRNA of the immunomodulatory molecule was barely detectable in the other cell lines. The data are presented as relative quantification compared with PcCL3 parental cells. The experiment was repeated two times in triplicate and the results are presented as mean ± S.D. (error bars) of the obtained data.
