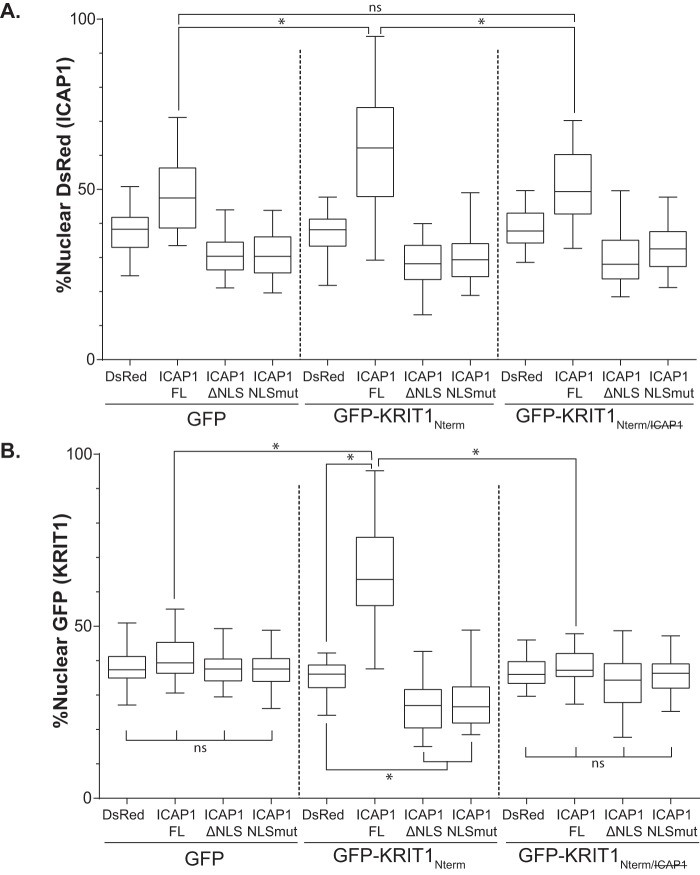
FIGURE 6.
Localization of KRIT1Nterm is driven by ICAP1. A and B, CHO cells co-overexpressing GFP-tagged KRIT1 constructs and DsRed-tagged ICAP1 constructs were plated on fibronectin, fixed 24 h later, and stained with DAPI to identify nuclei. Images were analyzed using CellProfiler. Percentage nuclear fluorescence compared with the total integrated fluorescence intensity of the entire cell for DsRed (A) and GFP (B) was calculated. Boxes, 25th through 50th and 50th through 75th percentile; whiskers, 5th through 95th percentile (n = 62–138 cells from 3 independent experiments). *, p ≤ 0.0001 as determined by a one-way ANOVA with Tukey's correction for multiple tests.

