FIGURE 9.
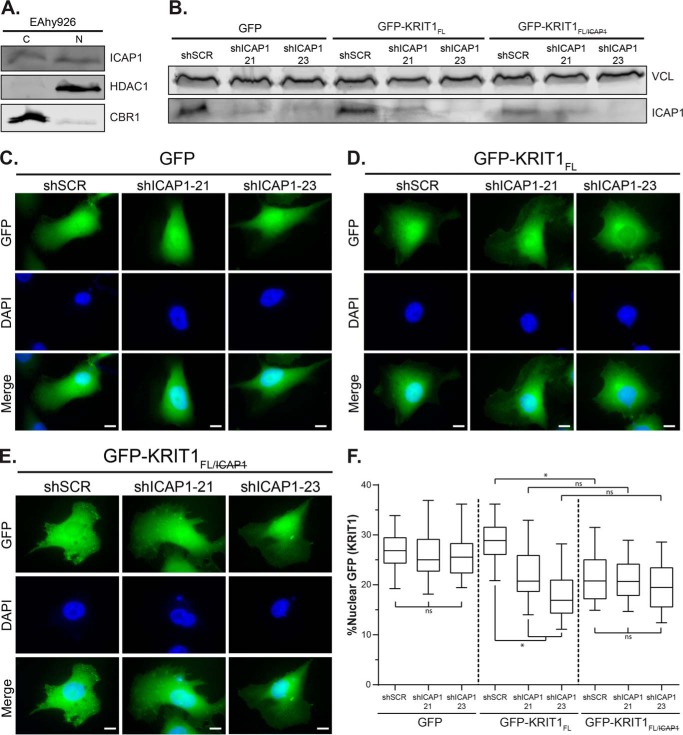
Localization of exogenous KRIT1 in EAhy926 cells changes upon loss of ICAP1. A, representative fractionation of endogenous ICAP1 in EAhy926 cells. C, 28% of the cytoplasmic fraction; N, 80% of the nuclear fraction. Carbonyl reductase (CBR1) and histone deacetylase (HDAC1) represent quality controls for cytoplasmic and nuclear fractions, respectively. Results are representative of three independent experiments. B, immunoblot of EAhy926 lysates that overexpress either GFP or GFP-tagged KRIT1 constructs and have been infected with either an shSCR or shRNAs targeting ICAP1 (shICAP1-21, shICAP1-23). Vinculin (VCL) was used as a loading control. C–E, EAhy926 cells infected with either shSCR or shICAP1 and overexpressing GFP or GFP-tagged KRIT1 constructs were plated on fibronectin, fixed 24 h later, and stained with DAPI to identify nuclei. Representative images are shown; bar, 10 μm. F, percentage of GFP intensity in the nucleus compared with the integrated GFP intensity of the entire cell. Boxes, 25th through 50th and 50th through 75th percentile; whiskers, 5th through 95th percentile (n = 88–93 cells from 3 independent experiments). *, p ≤ 0.0001 as determined by a one-way ANOVA with Tukey's correction for multiple tests.

