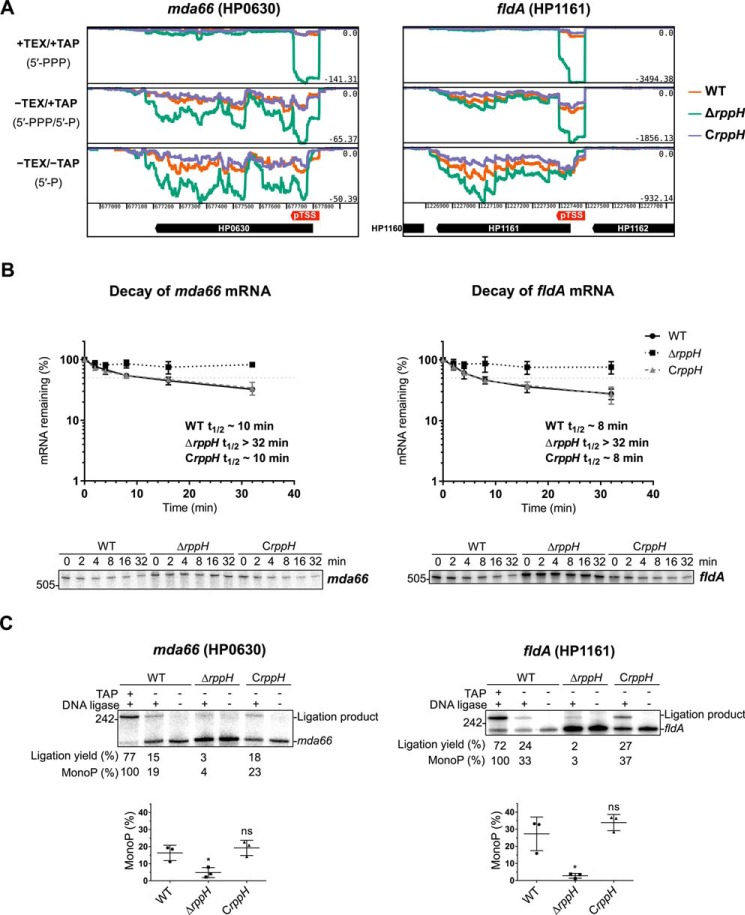
FIGURE 10.
mRNA targets of HpRppH. A, screen shots of RNA-seq data for the HpRppH targets mda66 mRNA (HP0630) and fldA mRNA (HP1161) in WT, ΔrppH, and CrppH cells, as visualized by using Artemis (56). B, half-lives of mda66 mRNA (∼621 nt long) and fldA mRNA (∼548 nt long) in H. pylori. RNA degradation was monitored by Northern blotting analysis of equal amounts of total RNA extracted from WT, ΔrppH, and CrppH cells at various times after the addition of rifampicin to log-phase cultures. Data from three biological replicates of each of the three strains were averaged, and half-lives (t½) were determined from the time at which 50% of the mRNA remained (light gray dotted lines). C, phosphorylation state of mda66 and fldA mRNA in H. pylori. Total RNA extracted from WT, ΔrppH, and CrppH cells was examined by PABLO analysis to determine the 5′-phosphorylation state of the transcripts in vivo. Top, representative PABLO assays. RNA samples that had first been treated in vitro with TAP were analyzed in parallel so that the ligation yields of fully monophosphorylated transcripts could be used as correction factors for calculating the percentage of mda66 and fldA that was monophosphorylated. Bottom, scatter plots showing the average of three independent PABLO experiments. Error bars, S.D. Student's t test was used for statistical comparison of the ΔrppH and CrppH data with the WT data. *, statistically significant difference (p ≤ 0.05); ns, not significant (p > 0.05).

