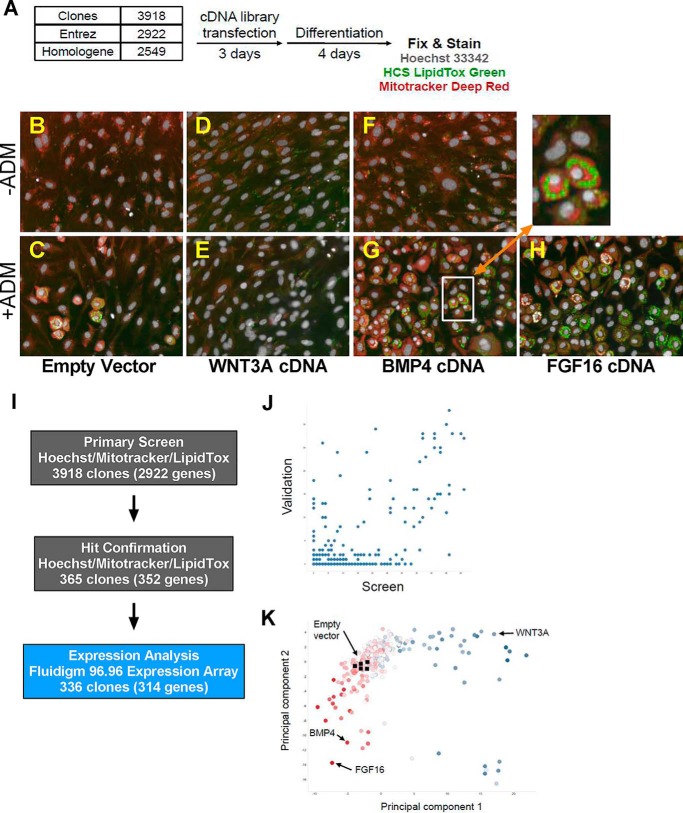
FIGURE 1.
A high content cell-based screen reveals FGF16 as an adipogenesis activator. A, a schematic describing the cell assay protocol. Cells were transfected with cDNA in 384-well format and treated with ADM after 72 h. After a second medium exchange and a total of 96 h of differentiation, cells were fixed and stained with Hoechst (nucleus), LipidTox Green (neutral lipid), and MitoTracker Deep Red (mitochondria) before imaging at ×20 on a PerkinElmer Opera QEHS. B–G, representative images of cells transfected with plasmid containing an empty vector neutral control, WNT3A, BMP4, or FGF16. B, D, and F, ADM negative media. C, E, G, and H, ADM positive media. I, outliers from the primary screen were technically validated by retesting and expression analysis by Fluidigm 96.96 dynamic arrays. J, linear correlation between screen (x axis) and validation (y axis) hits. K, the scatter plot depicts a principal component feature reduction of image and expression data for the clones and controls. Highlighted clones include fibroblastic mitogens (blue, such as WNT3A), neutral controls (clear, including empty vector controls), and pro-adipogenic factors (red, including BMP4).

