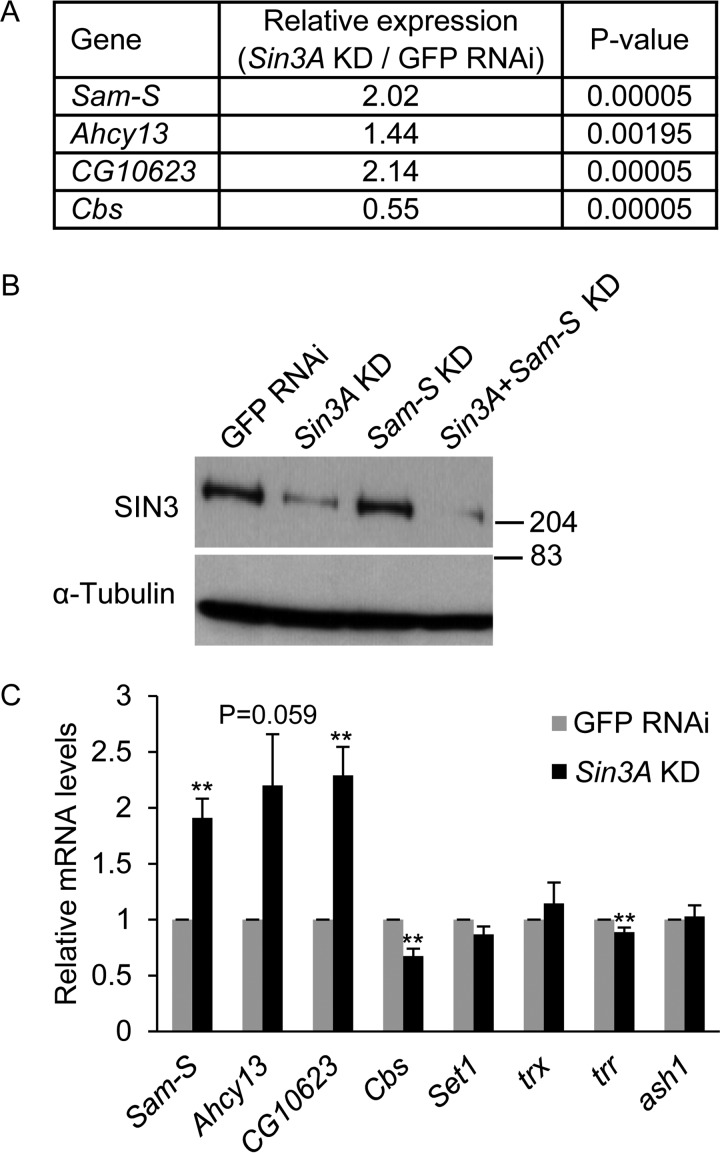
FIGURE 2.
Transcription of methionine metabolic genes is regulated by SIN3. A, expression of methionine metabolic genes as determined in an RNA-Seq profile (16). B, verification of Sin3A knockdown. Whole cell extracts from RNAi-treated cells were subjected to Western blotting analysis using the indicated antibodies. α-Tubulin acted as the loading control. Protein size markers are indicated on the right. C, real time qRT-PCR analysis of transcription of methionine metabolic genes and histone methyltransferase genes. The results are the averages of three independent biological replicates. The error bars represent standard error of the mean. Statistically significant results comparing individual knockdown samples to the control are indicated on knockdown samples. GFP RNAi cells are the control cells. **, p < 0.01.

