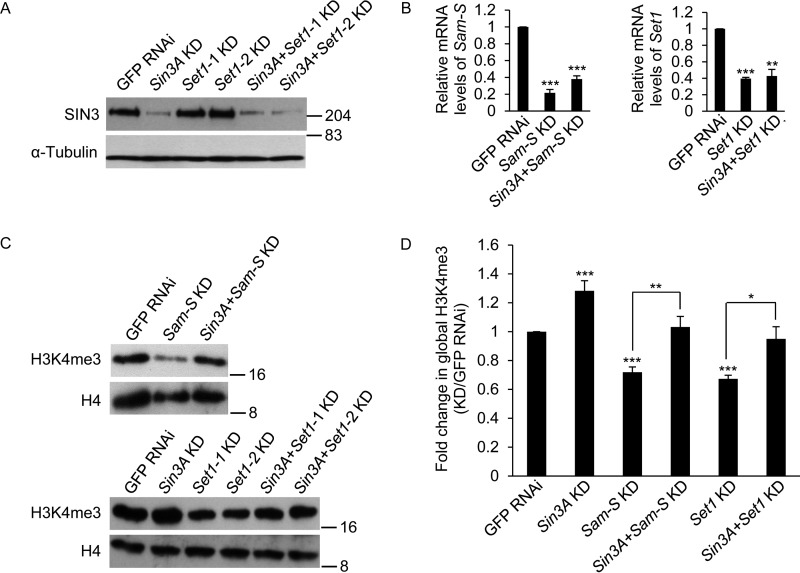
FIGURE 5.
Decreased global H3K4me3 levels caused by reduction of SAM-S or SET1 is restored to near control levels upon Sin3A knockdown. A, verification of Sin3A knockdown. Whole cell extracts from RNAi-treated cells were subjected to Western blotting analysis using the indicated antibodies. α-Tubulin acted as the loading control. Protein size markers are indicated on the right. B, real time qRT-PCR analysis of Sam-S and Set1 transcript level. C, whole cell extracts from RNAi-treated cells were subjected to Western blotting analysis using the indicated antibodies. Protein size markers are indicated on the right. D, Western blots as shown in C were repeated with protein extracts prepared from at least three independent cultures, and the results were quantified after normalization to histone H4. Set1-1 KD and Set1-2 KD used two different dsRNA targeting different regions of Set1 mRNA, but these regions overlap. Therefore, we used Set1-1 oligonucleotides for the rest of the study and referred to it as Set1 KD. The error bars represent standard error of the mean. Statistically significant results comparing individual knockdown samples to the control are indicated on knockdown samples. p values were also calculated between the double knockdown samples and each single knockdown sample for the two tested genes, e.g. Sin3A + Sam-S KD to Sin3A KD or Sin3A + Sam-S KD to Sam-S KD. Statistically significant results are indicated with the bars. GFP RNAi cells are the control cells. *, p < 0.05; **, p < 0.01; ***, p < 0.001.

