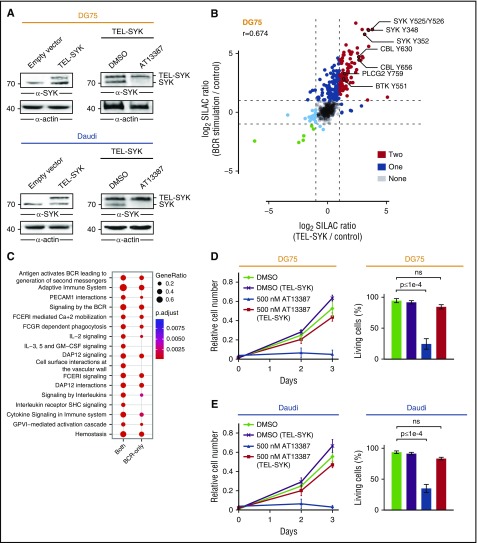
Figure 6.
TEL-SYK expression partially rescues the effect of HSP90 inhibition. (A) Anti-SYK immunoblot analysis of CCL from untreated DG75 and Daudi cells that were transduced with an empty control vector or a TEL-SYK fusion protein-encoding construct (left) and TEL-SYK expressing cells that were treated with DMSO or AT13387 (right). Actin was used as loading control. (B) Scatter plot of SILAC ratios normalized to untreated cells for the pYome MS analysis of DG75 cells. Untreated wild-type DG75 cells were labeled with “light” SILAC amino acids, BCR-stimulated (5 minutes) DG75 cells were labeled with “heavy” SILAC amino acids, and TEL-SYK–expressing DG75 cells were labeled with “medium” SILAC amino acids. Dots are color coded according to the number of conditions that induced pY upregulation by a factor >2. Selected pY sites are labeled. Spearman’s rank correlation coefficient (r) is indicated. (C) Pathway enrichment analysis of proteins harboring pY sites significantly regulated by both BCR stimulation and TEL-SYK expression (both) or by BCR stimulation only (BCR only). (D-E) Cell proliferation and Annexin V/7-AAD-based apoptosis assay of DG75 and Daudi cells that were transduced with an empty control vector or a TEL-SYK fusion protein-encoding construct and treated with DMSO or AT13387. Error bars are mean ± SD, n = 3. P values are from a 2-way analysis of variance test.

