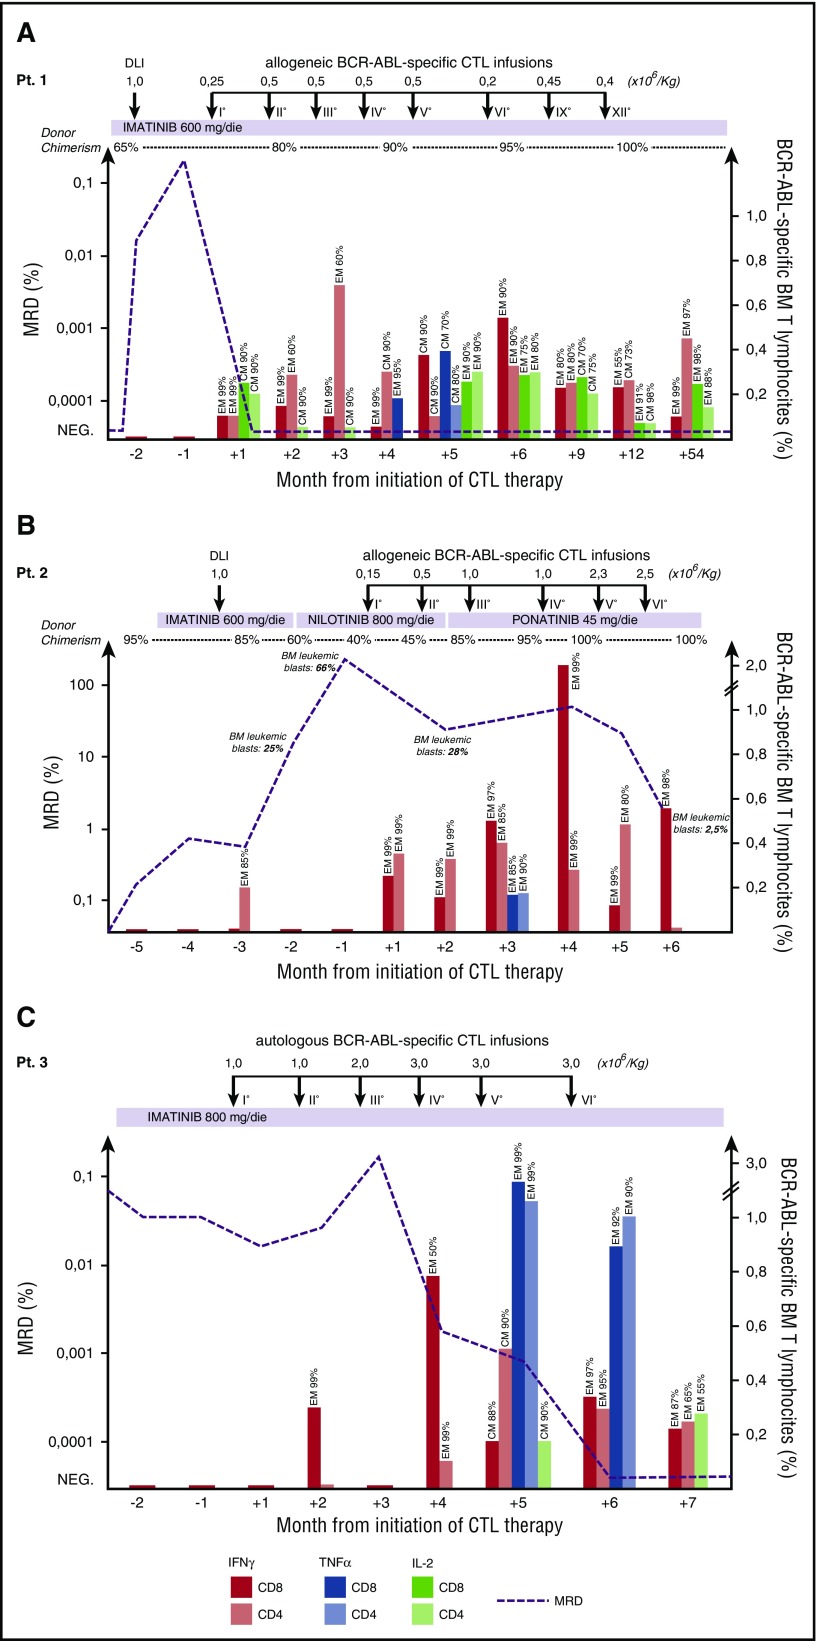
Figure 2.
Clinical and immunological responses to p190BCR-ABL–specific CTL infusion in 3 patients with molecular or hematological relapse of Ph+ ALL. Longitudinal data tracking MRD kinetics (left y-axis) and frequency of IFNγ-, interleukin 2 (IL-2)-, and tumor necrosis factor α (TNFα)-producing, p190BCR-ABL–specific, CD8+ and CD4+ T cells in the BM of patients, measured by flow cytometry and reported as the percentage of positive cells (right y-axis) are summarized in a single time-course graph for each patient. For each cytokine-producing T-cell subset, memory profiles are depicted over the related time points, defined as following: CD62L− CD45RA− (effector memory [EM]), CD62L+CD45RA− (central memory [CM]). On each patient’s graph, data on the percentage of donor chimerism, TKI treatment, and cell therapy (unmanipulated DLI; p190BCR-ABL–specific CTLs) timing and dose are also reported.

