Figure 2.
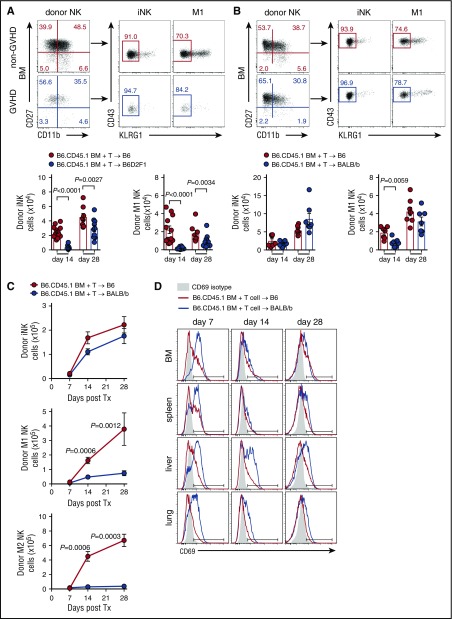
NK-cell subset reconstitution and activation during GVHD. (A) Donor NK-cell subsets (CD27+CD11b−CD43+KLRG1− [iNK], CD27+CD11b+CD43+KLRG1− [M1 NK], CD11b+CD27−CD43+KLRG1+ [M2 NK]) were examined, as indicated, in BM in the B6→B6D2F1 system. Representative dot plots from the BM at day 14 posttransplant are shown. Mean ± SEM pooled from 2 or 3 independent experiments per time point; n = 8 – 12 per group per time point. (B) Donor NK-cell subsets were examined in the BM in the B6→BALB/b system. Representative dot plots from the BM at day 14 posttransplant are shown. Mean ± SEM pooled from 2 independent experiments per time point; n = 7-8 per group per time point. (C) Quantitation of donor-derived splenic NK-cell subsets (B6→BALB/b). Mean ± SEM pooled from 1 (day 7) or 2 (day 14 and day 28) independent experiments per time point; n = 3-8 per group per time point. (D) CD69 expression by donor NK cells in the BM, spleen, liver, and lung was assessed at day 7, day 14, and day 28 in the B6→BALB/b model. Representative histograms are shown from 2 independent experiments per time point; n = 3-8 per group per time point.

