Figure 7.
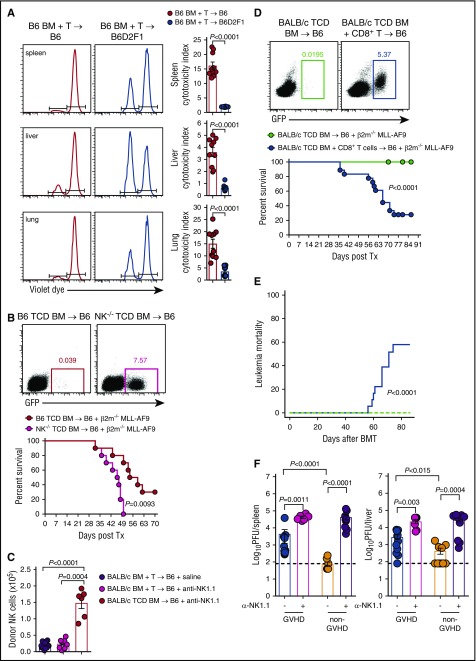
Failure to reconstitute NK-cell during GVHD impairs GVL and CMV responses. (A) B6.BM and CD3+ T cells were transplanted into lethally irradiated B6 or B6D2F1 recipients. At day 14 posttransplant, 20 × 106 NK-resistant RMA cells and 20 × 106 NK-sensitive RMA-S cells labeled with high and low concentrations of violet proliferation dye, respectively, were injected IV. Sixteen hours later, the ratio of RMA:RMA-S was quantified to determine the cytotoxic capacity of NK cells in the spleen, liver, and lung. Representative histograms are shown. Mean ± SEM pooled from 2 independent experiments; n = 10 per group. (B) Lethally irradiated B6 mice received either B6.TCD BM or TCD B6.NKp46cre+.Mcl1fl/fl BM together with 104 GFP+ β2m−/− MLL-AF9 AML cells and monitored for survival. Representative dot plots of peripheral blood day 42 post-MLL-AF9 injection are shown. Kaplan-Meier overall survival plot from 2 independent experiments is shown; n = 10 per group. (C) Lethally irradiated B6 mice were treated with saline or anti-NK1.1 and transplanted with TCD BALB/c.BM ± T cells. Donor NKp46+CD122+ NK cells were enumerated at day 7; n = 9-15 in T-cell replete and n = 6 in TCD groups from 2 combined experiments. (D-E) Lethally irradiated B6 mice received either TCD BALB/c.BM with or without sorted BALB/c CD8+ T cells. At day 14 posttransplant, 2 × 10⁵ GFP+ β2m−/− MLL-AF9 AML cells were transferred and survival was monitored. Representative dot plots of peripheral blood from day 49 post-MLL-AF9 injection are shown. (D) Kaplan-Meier overall survival plot and (E) leukemia mortality by competing risk analysis from 3 independent experiments is shown; n = 18 per group. (F) Lethally irradiated BALB/c recipients were transplanted with either B6.BM and CD4+ T cells (GVHD group) or B6.TCD BM alone (non-GVHD group), allowed to engraft for 21 days, then infected with MCMV. Two additional GVHD and non-GVHD groups received anti-NK1.1 antibody prior to and during MCMV infection (day −2, 0, and +2). Viral loads, measured as plaque-forming units (PFU), in the spleen and liver were determined 4 days later. Mean ± SEM pooled from 2 independent experiments; n = 6-11 per group. Mann-Whitney tests performed in panels A, C, and F. The log-rank (Mantel-Cox) test was performed for the survival data in panels B and D. Incidence of leukemia mortality in panel E was performed by competing risk analysis using R software.

