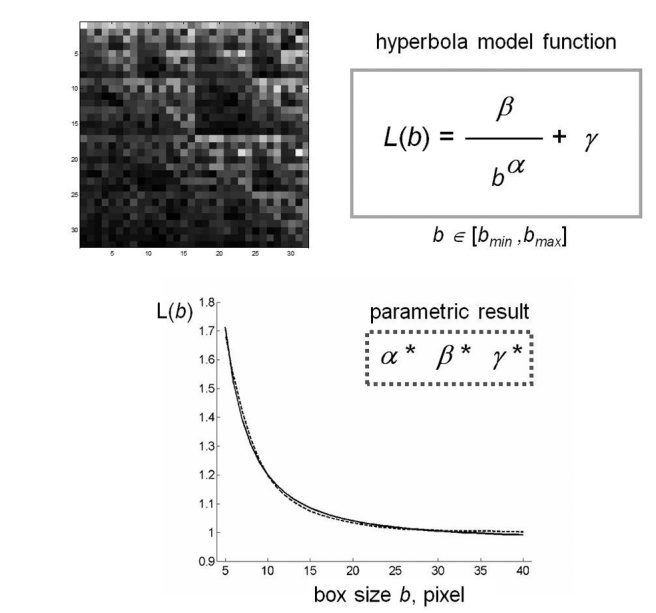
Figure 3.

Schematic representation of fractal lacunarity analysis. (Top left) rCRS mtDNA image generated by CGR matrix for L=5 is a 32x32 square. The plot (bottom) represents the result of GBA application (dotted line), for bmin=3, as fitted by hyperbola function (solid line) used to calculate the triplet of parameters a, b, γ. rCRS: revised Cambridge Reference Sequence; Chaos Game Representation; GBA: Gliding Box Algorithm.
