
Figure 4.
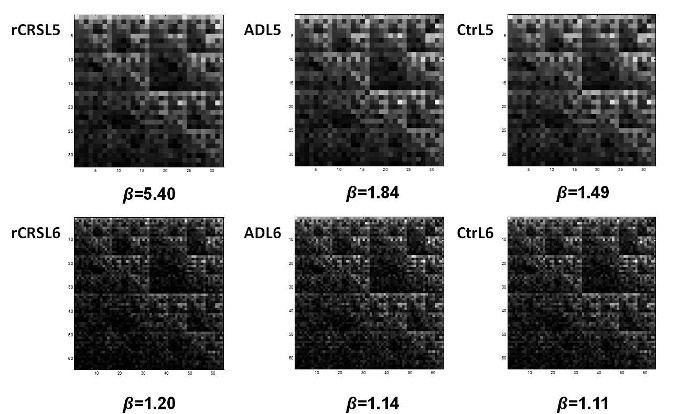
Examples of CGR images of mtDNA sequences from different subjects. Matrices for L=5 (top) and L=6 (bottom) generated from mtDNA of rCRS (left), AD patient (middle), and Control (Ctr, right). Lacunarity parameter b value for each representation is reported. CGR: Chaos Game Representation; rCRS: revised Cambridge Reference Sequence; AD: Alzheimer’s Disease.