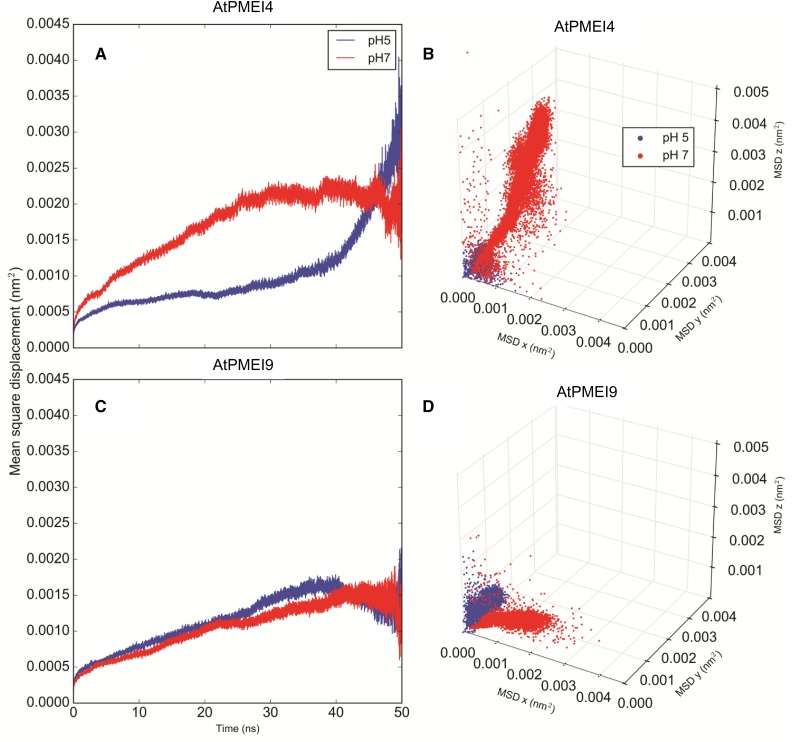
Figure 3.
Dynamics of AtPMEI4 and AtPMEI9 as revealed by MD simulations. A and C, MSD of AtPMEI4 and AtPMEI9 inhibitors at pH 5 (blue) and pH 7 (red) averaged along all the collected trajectories after MD of the AtPME3-AtPMEI4/AtPMEI9 complexes. B and D, MSD decomposed in the x, y, and z dimensions. The MSD was calculated for the PMEIs in complex with AtPME3 after removing the translational and conformational motions of AtPME3.

