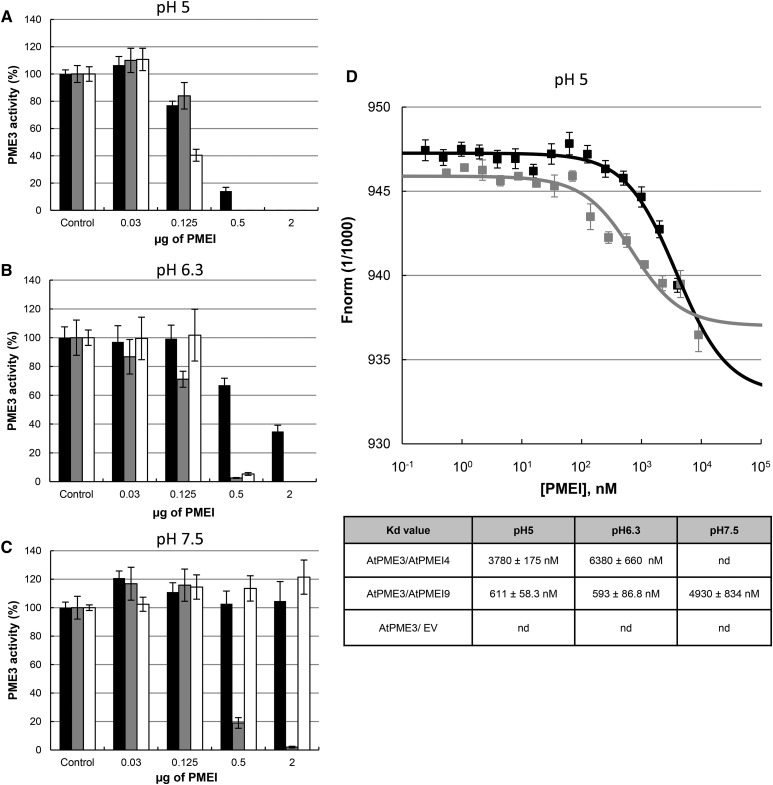
Figure 9.
Recombinant AtPMEI4 and AtPMEI9 show distinct pH-dependent inhibition capacities toward recombinant AtPME3 activity. A to C, Inhibition of AtPME3-6xHis activity by 6xHis-AtPMEI4, 6xHis-AtPMEI9, and AcPMEI using 1 milliunit of PME3 at pH 5 (A), pH 6.3 (B), and pH 7.5 (C) and various quantities of purified PMEIs: 6xHis-AtPMEI4 (black bars), 6xHis-AtPMEI9 (gray bars), and AcPMEI (white bars). Results are means ± sd of three replicates. D, Molecular interaction studies between recombinant AtPME3, 6xHis-AtPMEI4, and 6xHis-AtPMEI9 by MST. The graph at top corresponds to the interaction of recombinant PME3 measured at pH 5 with 6xHis-AtPMEI4 (black bars) and 6xHis-AtPMEI9 (gray bars). Concentrations on the x axis are plotted in nm. The table at bottom corresponds to the Kd values determined for the same experiment performed at pH 5, 6.3, and 7.5. Kd values are calculated in nm. nd, Not detected.

