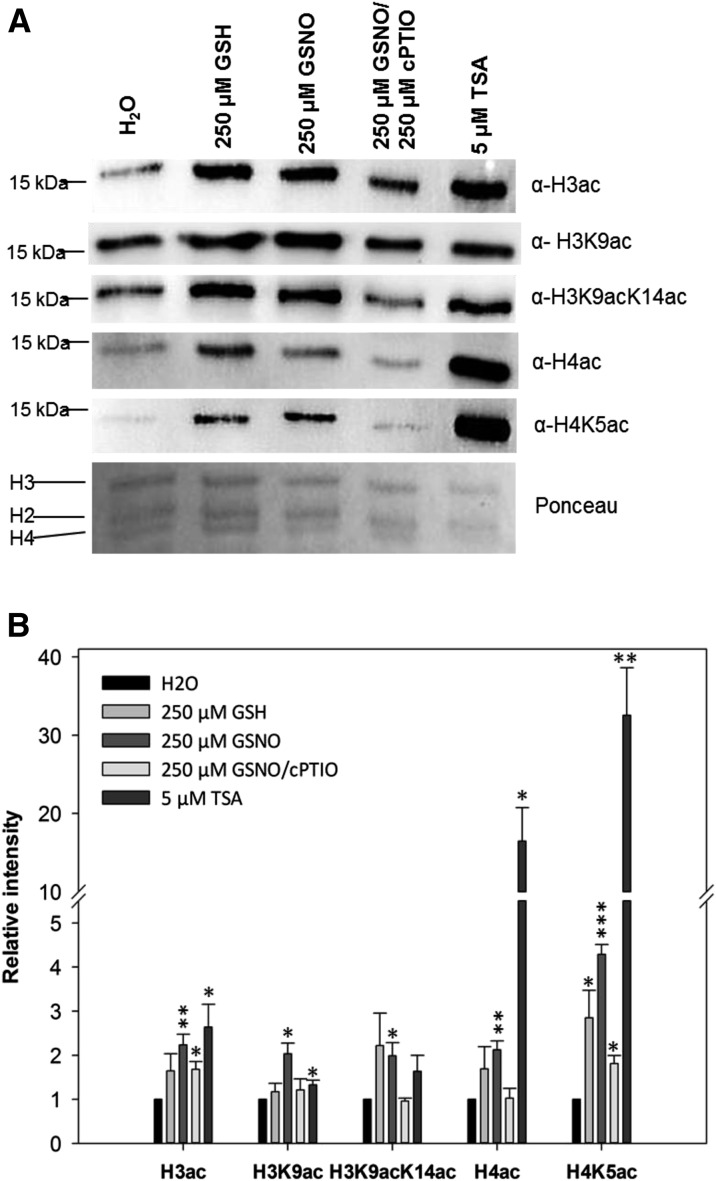
Figure 1.
Histone acetylation in Arabidopsis seedlings after GSNO, GSH, GSNO/cPTIO, and TSA treatments. A, Histones were extracted from liquid-grown seedlings treated with 250 µm GSNO, 250 µm GSH, 250 µm GSNO/500 µm cPTIO, 5 µm TSA, or water (control) and probed against different histone acetylation marks by western blot. As a loading control, the Ponceau S-stained membrane is shown. One representative experiment out of three is shown. B, Quantification of western-blot results. Signal intensities were measured using ImageJ software and normalized to the amount of loaded H3. Values are expressed as fold change over the control treatment. Values shown are means ± se of three independent experiments. *, P < 0.05; **, P < 0.01; and ***, P < 0.001 by Student’s t test.

