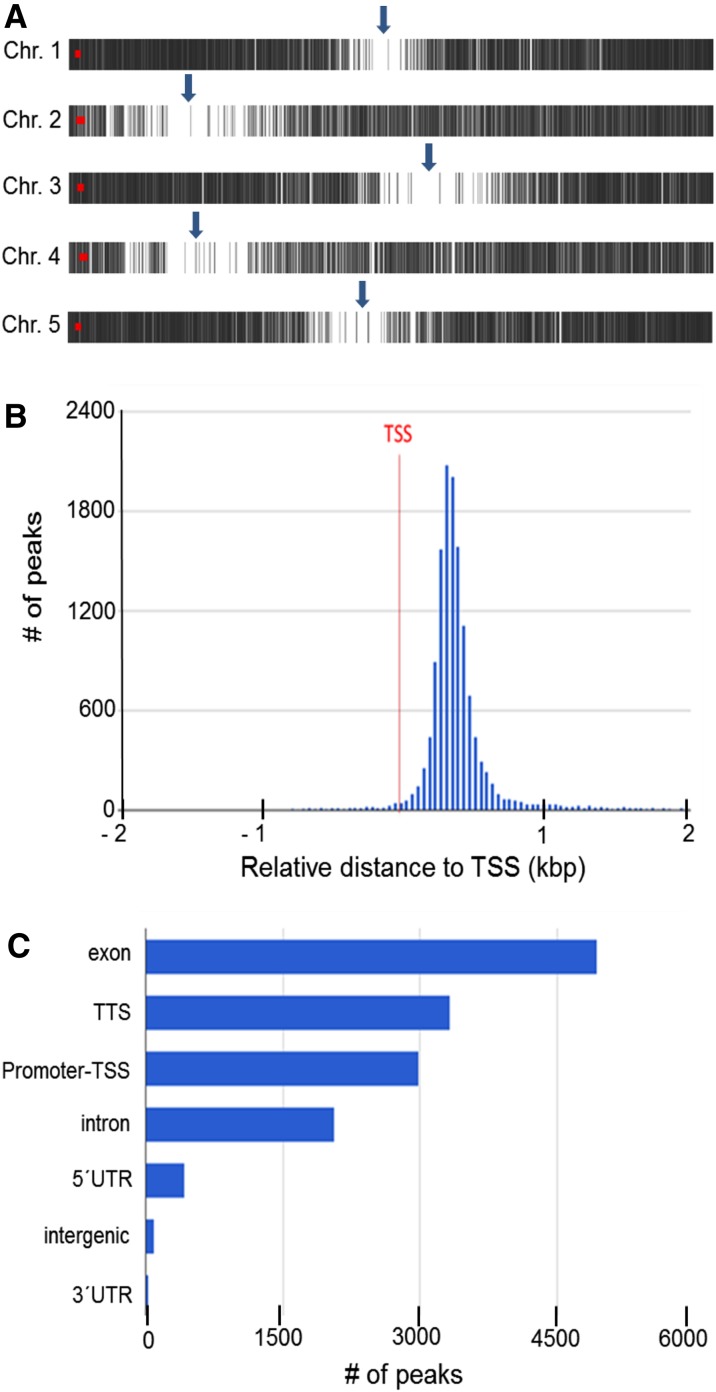
Figure 3.
General features of H3K9/14ac. A, H3K9/14ac distribution along Arabidopsis chromosomes. Each vertical gray line represents one H3K9/14ac peak. Arrows indicate the approximate positions of centromers. This image was prepared using PAVIS. B, Histogram of the distance of peak centers to the nearest annotated TSS. C, Location annotation of peaks. Peaks were annotated to functional DNA elements. TTS, Transcription termination site; UTR, untranslated region. B and C were prepared using the ChIPseek software portal (Chen et al., 2014).

