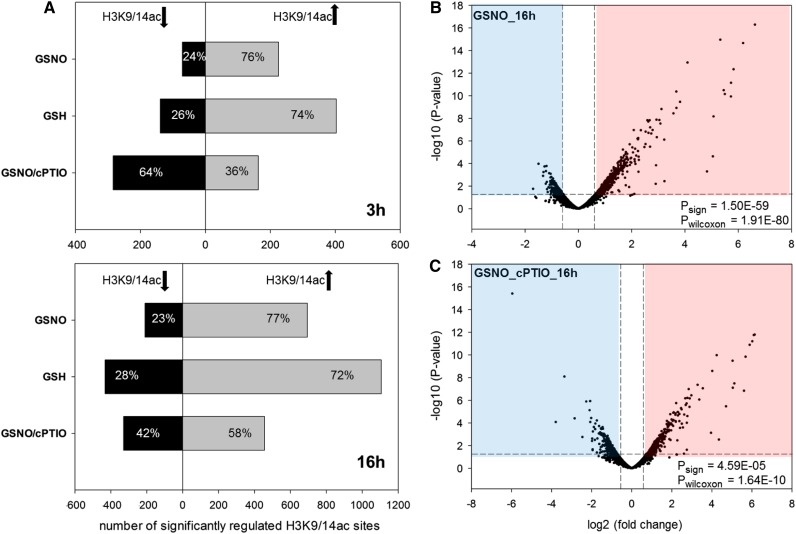
Figure 4.
Effects of GSNO, GSH, and GSNO/cPTIO treatments on H3K9/14ac. A, For each treatment, significant H3K9/14ac changes (P < 0.05) were determined in comparison with the control treatment using DiffBind software. Shown are the numbers of H3K9/14ac sites that display enhanced (gray bars) or decreased (black bars) acetylation after 3 h (top) and 16 h (bottom) of treatment. B and C, Volcano plots in which the –log10 (P value) of each analyzed H3K9/14ac site is plotted versus the corresponding log2 (fold change [treatment over control]). The horizontal dashed lines correspond to a P value of 0.05, and the vertical dashed lines mark fold changes of ±log2 (1.5). To test for significant differences in the number of peaks with enhanced or decreased H3K9/14ac among the peaks with P < 0.05, sign tests were performed (Psign). To test whether peaks with increased H3K9/14ac show higher absolute log2 (fold change) compared with peaks with decreased H3K9/14ac, Wilcoxon signed-rank tests were performed (Pwilcoxon).

