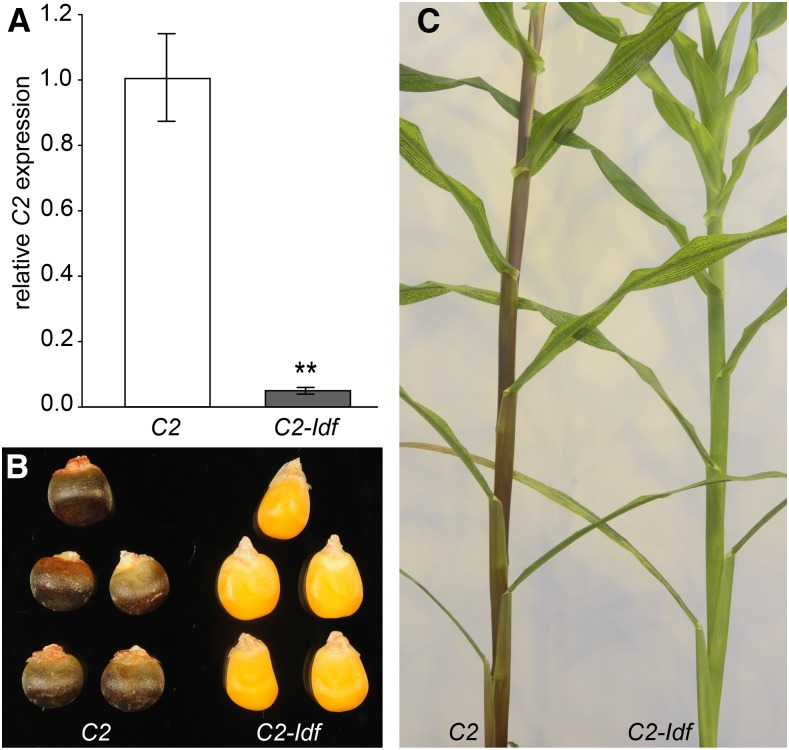
Figure 2.
Expression levels of C2 (CHS) and visible C2-Idf mutant phenotypes. A, Expression levels of C2 (CHS) in C2 control and C2-Idf mutant internodes were determined by RT-qPCR and are shown relative to the highest C2 expression value within the replicates. Error bars represent se of three biological replicates. **, P < 0.01. B, Photograph of representative C2 control and C2-Idf mutant seeds. C, Photograph of representative plants at the V14 stage, showing the vegetative tissues.

