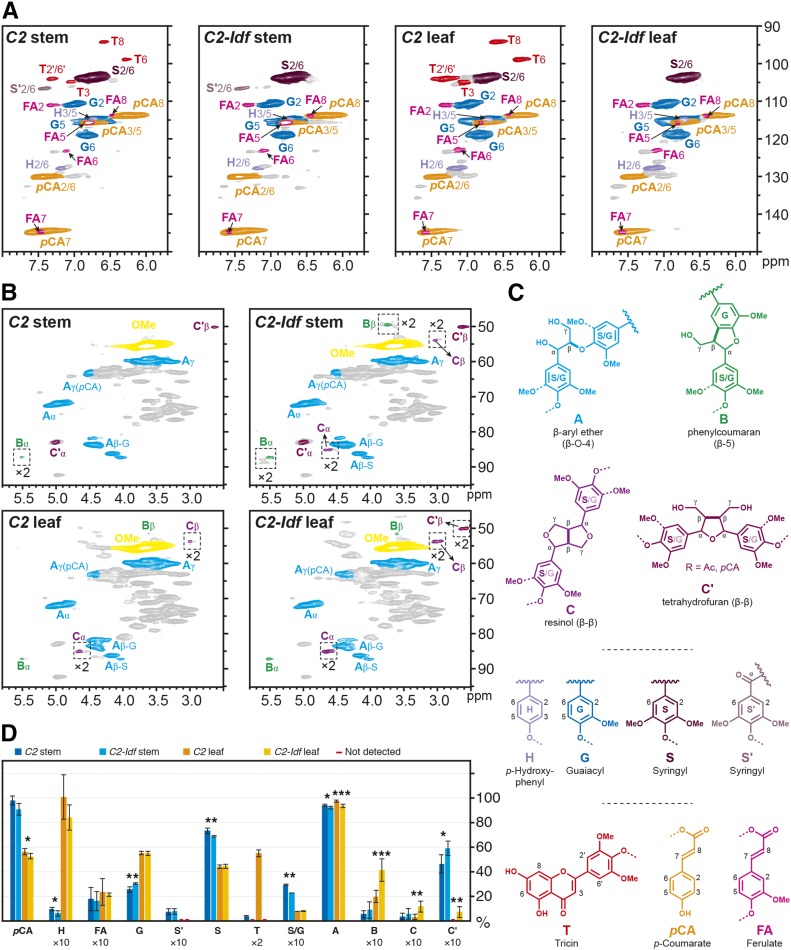
Figure 3.
HSQC spectra of the enzymatic lignins from stem and leaf of C2-Idf mutant and C2 control plants. A and B, Spectra of the aromatic regions and the side chain regions, respectively. C, The colors of the substructures shown match those of the corresponding signals in the HSQC spectra. The signal intensities in the framed areas indicated by ×2 are at twice the intensity for convenience. D, The bar graph shows the quantification of the lignin units with their characteristic interunit linkages, with some of them, for convenience, being shown as 2- or 10-fold of their original value, as indicated by ×2 and ×10. For statistics, the leaf and stem material of C2-Idf was compared with leaf and stem of the C2 control, respectively. *, 0.05 < P ≤ 0.01; **, 0.01 < P ≤ 0.001; and ***, P < 0.001. For values corresponding to the data points in this graph, see Supplemental Table S3.

