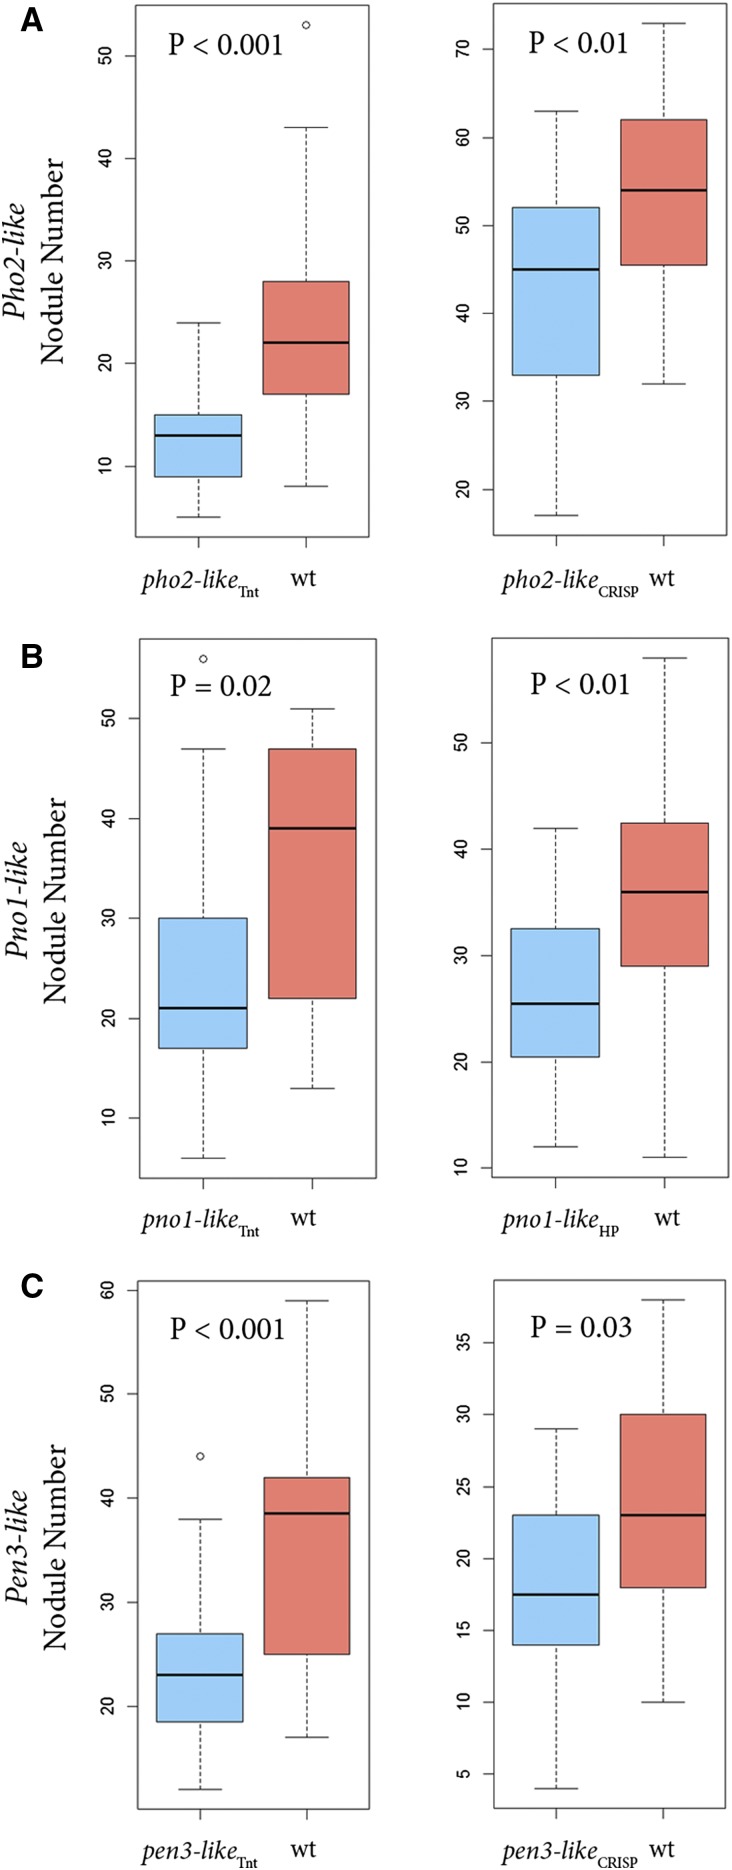
Figure 4.
Nodule number produced by mutant and wild-type plants. Nodules were counted 32 to 42 dpi. Data are shown for two independent mutants for each of three candidate genes. A, PHO2-like; B, PNO1-like; C, PEN3-like. For each figure, the horizontal black bar represents the median value, the box the middle quartiles, and the whiskers the range of data, except for outliers shown as a single data point.

