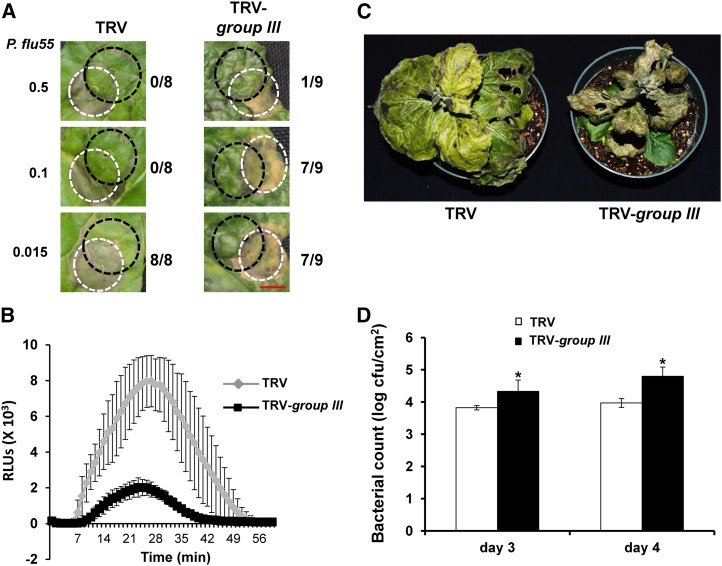
Figure 7.
The group III ubiquitin E2s are required for PTI. A, VIGS of group III E2 genes in N. benthamiana compromised PTI-mediated cell death suppression. The group III ubiquitin E2 gene-silenced (TRV-group III) and nonsilenced TRV control (TRV) N. benthamiana plants were first infiltrated with P. fluorescens 55 (P. flu55; marked as black dashed circles) to induce PTI, which was followed by infiltration of the HR-causing strain of Pst, DC3000 (marked as white dashed circles). Numbers at the left side denote the corresponding concentration of P. flu55 (OD600 value) used to activate PTI. The numbers at the right side represent the number of overlapped infiltration areas that displayed cell death and the total number of infiltrated overlapping areas. Photographs were taken on day 4 after infiltration of Pst DC3000. Bar = 1 cm. B, Silencing the group III E2 genes resulted in reduced ROS production induced by flg22 in a chemiluminescence assay. Leaf discs of the group III ubiquitin E2 gene-silenced (TRV-group III) and nonsilenced TRV control (TRV) N. benthamiana plants were incubated with 1 μm flg22 to induce ROS production. RLU, Relative light units. C, Disease symptoms of the group III E2 gene-silenced (TRV-group III) and nonsilenced TRV control (TRV) N. benthamiana plants. Plants were vacuum infiltrated with P. flu55 to induce PTI and then inoculated with Pst strain DC3000ΔhopQ1-1 6 h later. The photograph was taken on day 6 after Pst inoculation. D, Bacterial populations of leaves from plants shown in C. Each treatment represents the mean of four plants, and bars show sd. Experiments were repeated three times with similar results. Asterisks indicate significantly elevated bacterial growth compared with the TRV empty vector (TRV) control plants based on one-way ANOVA (P < 0.01). cfu, Colony-forming units. The experiments in Figure 7 were repeated three times with similar results.

