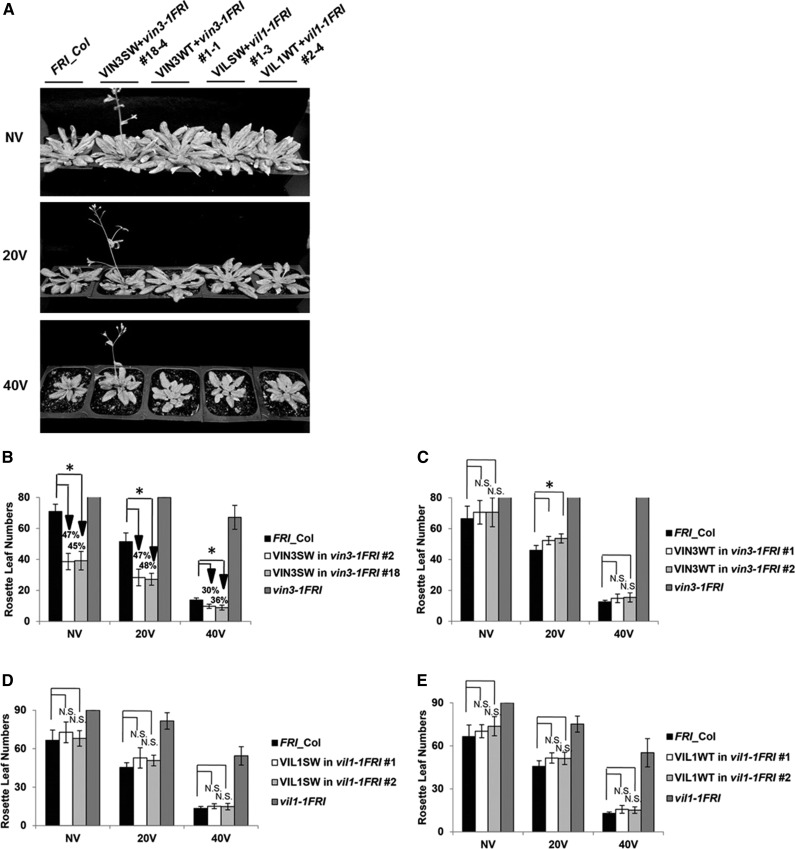
Figure 2.
The hypervernalization response in VIN3SW transgenic lines. A, Accelerated flowering is observed in VIN3SW transgenic plants in vin3-1FRI mutant background in all vernalization time points. NV, Nonvernalized; 20V, 20 d vernalized; 40V, 40 d vernalized. Plants were grown under long-day conditions (16 h light and 8 h dark) after vernalization treatment. B, Flowering times of two representative homozygous transgenic plants of VIN3SW in vin3-1FRI after various durations of vernalization treatment. Earlier flowering are indicated by downward arrows and changes in the percentage compared to the wild-type plants (FRI_Col). C, Flowering times of two representative transgenic plants of VIN3WT in vin3-1FRI after various durations of vernalization treatment. B and C, FRI_Col (wild type) and vin3-1FRI mutants are used as controls for vernalization response. D, Flowering times of two representative homozygous transgenic plants of VIL1SW in vil1-1FRI after various durations of vernalization treatment. E, Flowering times of two representative homozygous transgenic plants of VIL1WT in vil1-1FRI after various durations of vernalization treatment. D and E, FRI_Col (wild type) and vil1-1FRI mutants are used as controls for vernalization response. B to D, Asterisks indicate statistically significant differences in flowering times compared to the wild-type (FRI_Col) plants. N.S., Not significant (Student’s t test, P < 0.01; n = 12).

