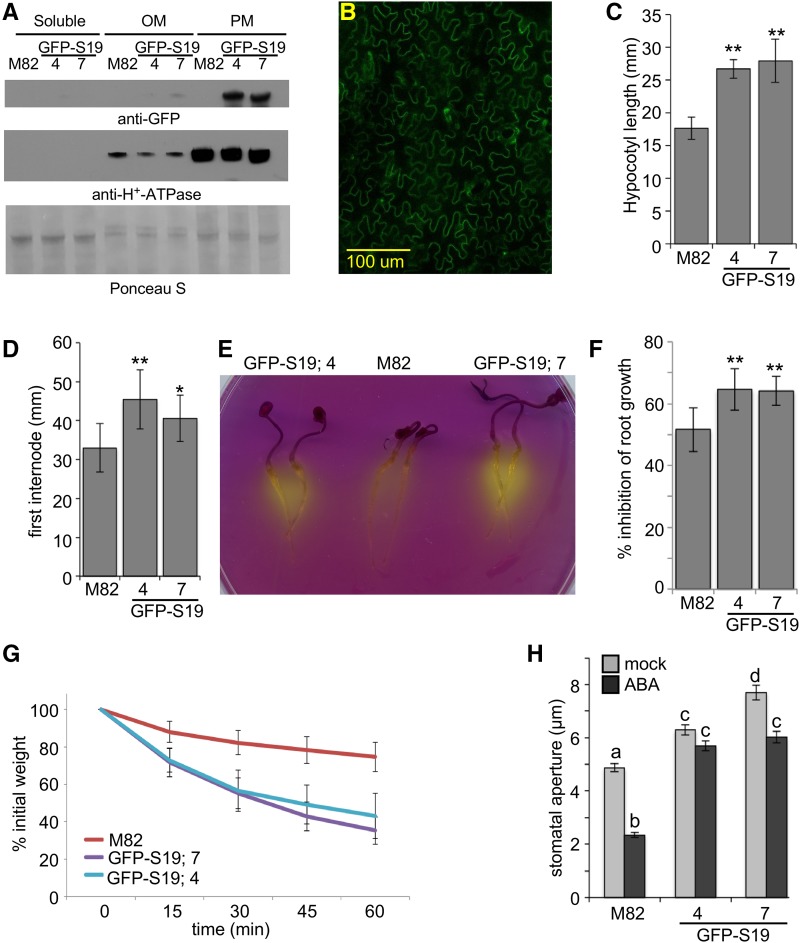
Figure 1.
35S:GFP-AtSAUR19 expression in tomato. A, Five micrograms of soluble, lower phase-enriched other membrane (OM) or upper phase-enriched plasma membrane (PM) fractions prepared from 8-d-old M82 or 35S:GFP-AtSAUR19 (GFP-S19) seedlings were immunoblotted with α-GFP and α-AHA antibodies. A section of the Ponceau S-stained blot is shown as a loading control. GFP-S19.4 and GFP-S19.7 are two independent transgenic lines expressing the 35S:GFP-AtSAUR19 transgene. B, Confocal image of GFP-AtSAUR19 tomato leaf epidermal cells. C and D, Mean (±sd) hypocotyl lengths of 8-d-old seedlings (n ≥ 15; C) and first internode lengths of 27-d-old plants (n ≥ 12; D). Asterisks indicate significant difference from the wild type: **P ≤ 0.01 and *P ≤ 0.05. E, Three-day-old seedlings were transferred to plates containing the pH indicator dye, bromocresol purple, and incubated an additional 24 h. F, Percentage of root growth inhibition ± sd by 12.5 mm LiCl. **P ≤ 0.01. G, Kinetics of water loss in leaf detachment assays. Data depict relative mean weights of ≥24 leaves/genotype ± sd. Both GFP-AtSAUR19 transgenic lines exhibit significant differences from M82 at all time points after t = 0 (P ≤ 0.05). H, Mean stomatal apertures (±se) of epidermal peels obtained from 27-d-old tomato leaves incubated in opening buffer ± 10 μm ABA for 2 h. Different letters above bars indicate significant (P ≤ 0.01) difference when analyzed by one-way ANOVA with Tukey’s HSD test.

