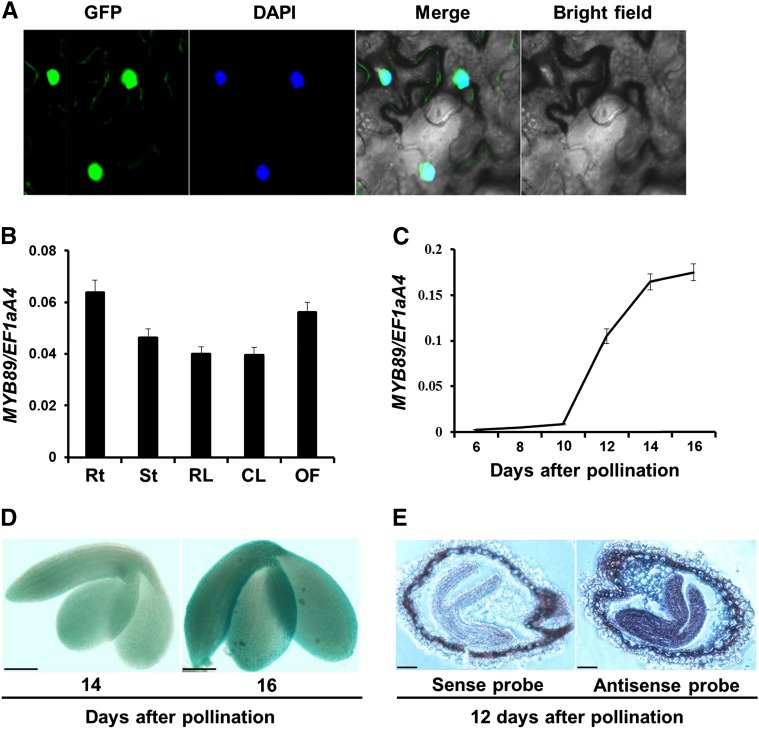
Figure 1.
Analysis of MYB89 expression pattern. A, Subcellular localization of the MYB89 protein fused with GFP (35S:MYB89-GFP) in N. benthamiana leaves. DAPI, Fluorescence of 4′,6-diamino-2-phenylindole; Merge, merge of GFP, DAPI, and bright-field images. B, qRT-PCR analysis of MYB89 expression in various tissues of the wild type Columbia-0 (Col-0). Rt, Roots; St, stems; RL, rosette leaves; CL, cauline leaves; OF, open flowers. Results were normalized against the expression of EF1aA4 as an internal control. Values are means ± sd (n = 3). C, qRT-PCR analysis of MYB89 expression in developing seeds of the wild type (Col-0). Results were normalized against the expression of EF1aA4 as an internal control. Values are means ± sd (n = 3). D, Representative GUS staining of pMYB89:GUS transgenic plants shows MYB89 expression in developing embryos at 14 and 16 DAP in the wild type (Col-0). Bars = 100 µm. E, mRNA in situ localization of MYB89 in wild-type (Col-0) developing seeds at 12 DAP. These seeds were hybridized with the antisense or sense MYB89 probe as indicated. Bars = 100 µm.

