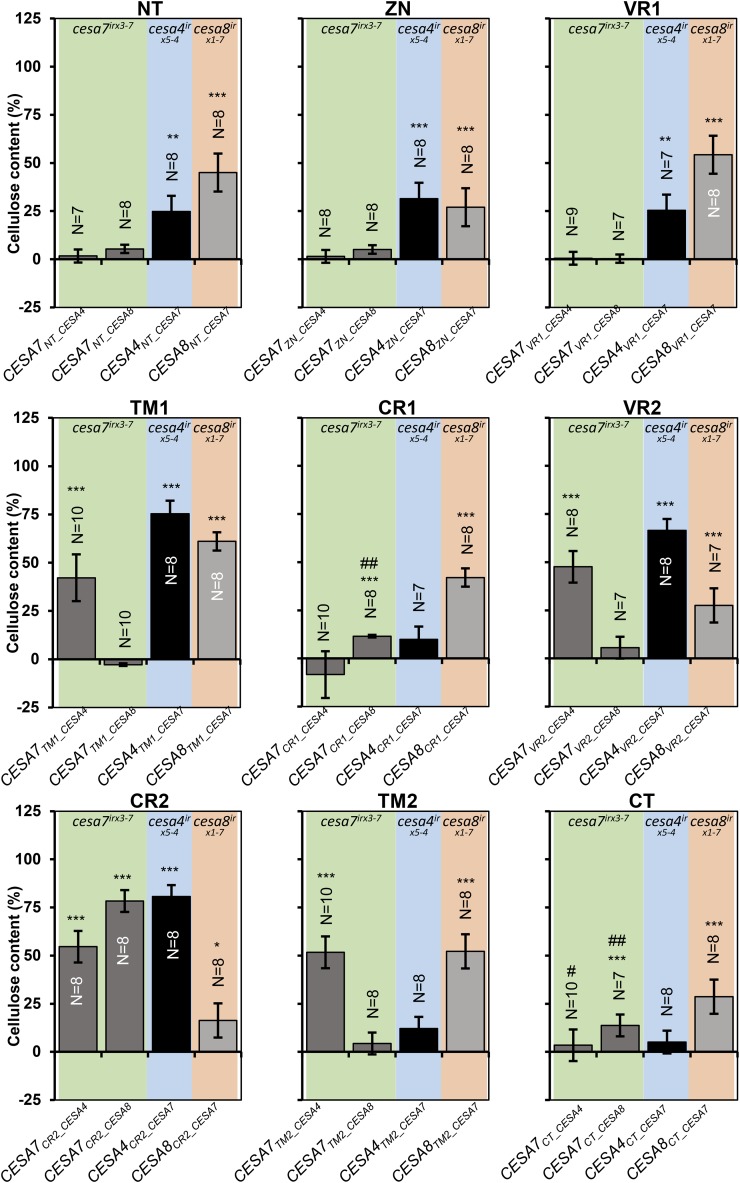
Figure 2.
Cellulose content of single swap constructs transformed into the recipient cesa mutant backgrounds. Error bars are SEM. Significance levels from univariate ANOVA between the genotype and the mutant background are shown *** Significant at 0.001, ** significant at 0.01, * significant at 0.05, # significant differences in plant height in Figure 3, ## plant height differences not significant in Figure 3.

