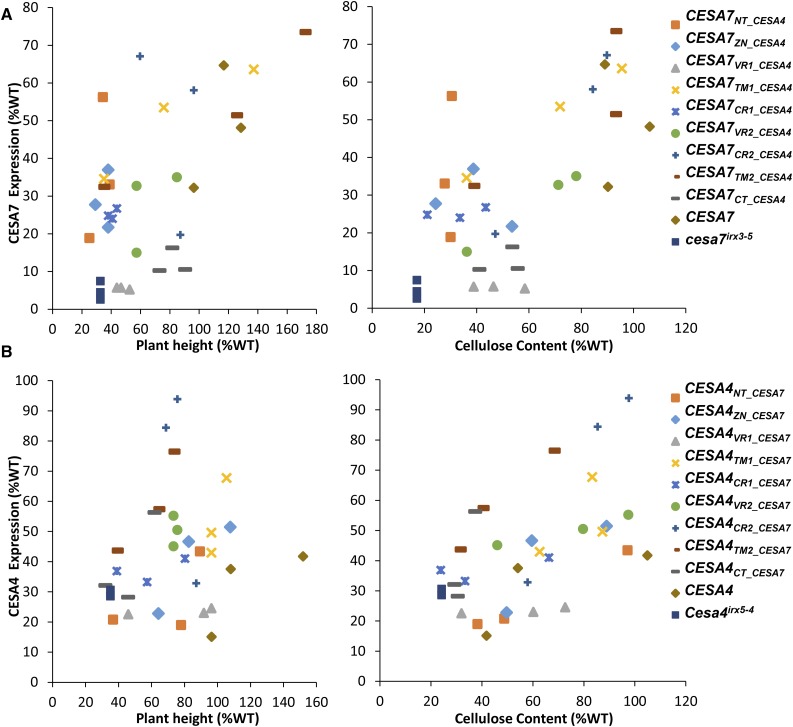
Figure 7.
Analysis of protein expression in the swap constructs. Level of expression was measured for CESA7 (A) or CESA4 (B) using quantitative western-blot analysis. All extracts were also simultaneously probed with anti-HSP73 antibody to normalize for loading variations. HSP73 normalized signals were then expressed as percentage of Col-0 wild type (WT) and plotted against plant height or cellulose content. Western-blot images used in calculating the normalized protein expression are shown in Supplemental Figure S10. CESA7 and CESA4 antibodies used in these experiments were raised against the VR1 domain, which would mean that any expression in CESA7VR1_CESA4 and CESA4VR1_CESA7 is the background level of expression.

