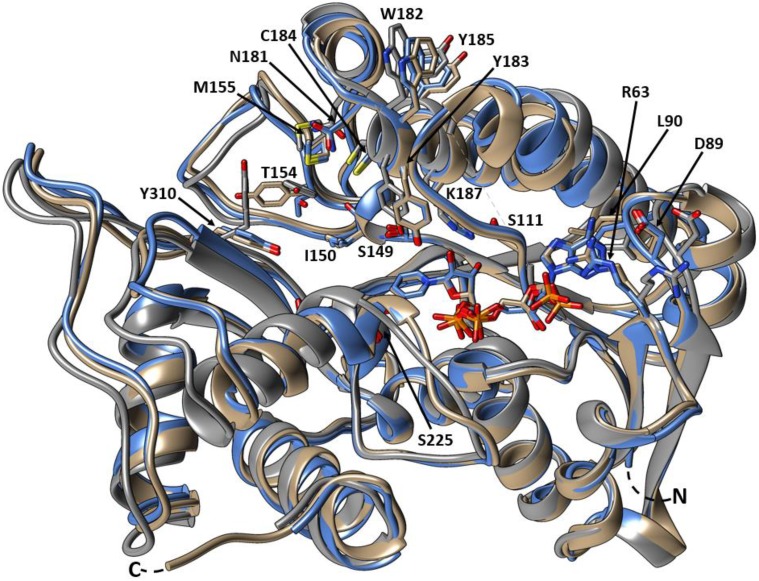
Figure 5.
Superimposed tertiary structures of SbCCR1 and other CCRs. Depicted are SbCCR1 (blue), PhCCR1 (tan), and MtCCR2 (gray). Catalytic and phenylpropanoid-binding residues, as well as NADP+ from the SbCCR1 and PhCCR1 models, are represented as sticks. Conserved residues are represented according to residue type and sequence position in SbCCR1. Molecular graphics images were produced using the UCSF Chimera package.

