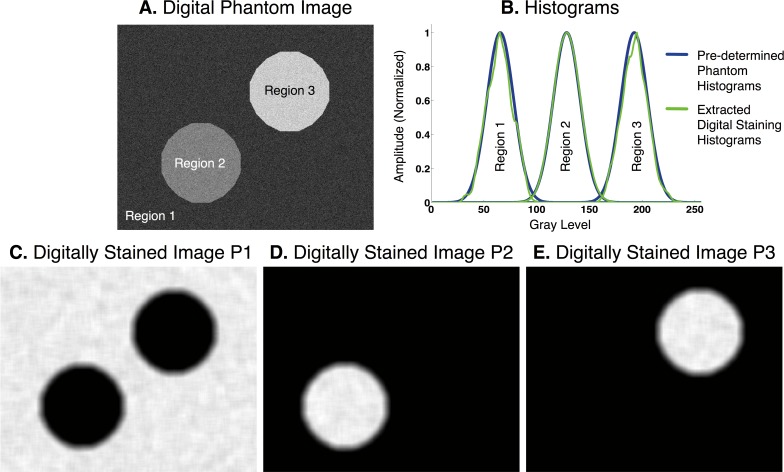
Figure 1.
(A) A digital phantom was generated with three regions, each of which had pixel intensities that followed a randomly generated Gaussian distribution. (B) Predetermined histogram-vectors of the digital phantom for the three regions are compared with those extracted with digital staining. A good agreement was obtained. (C–E) Digitally stained images P1, P2, and P3 that highlight regions 1, 2, and 3, respectively.

