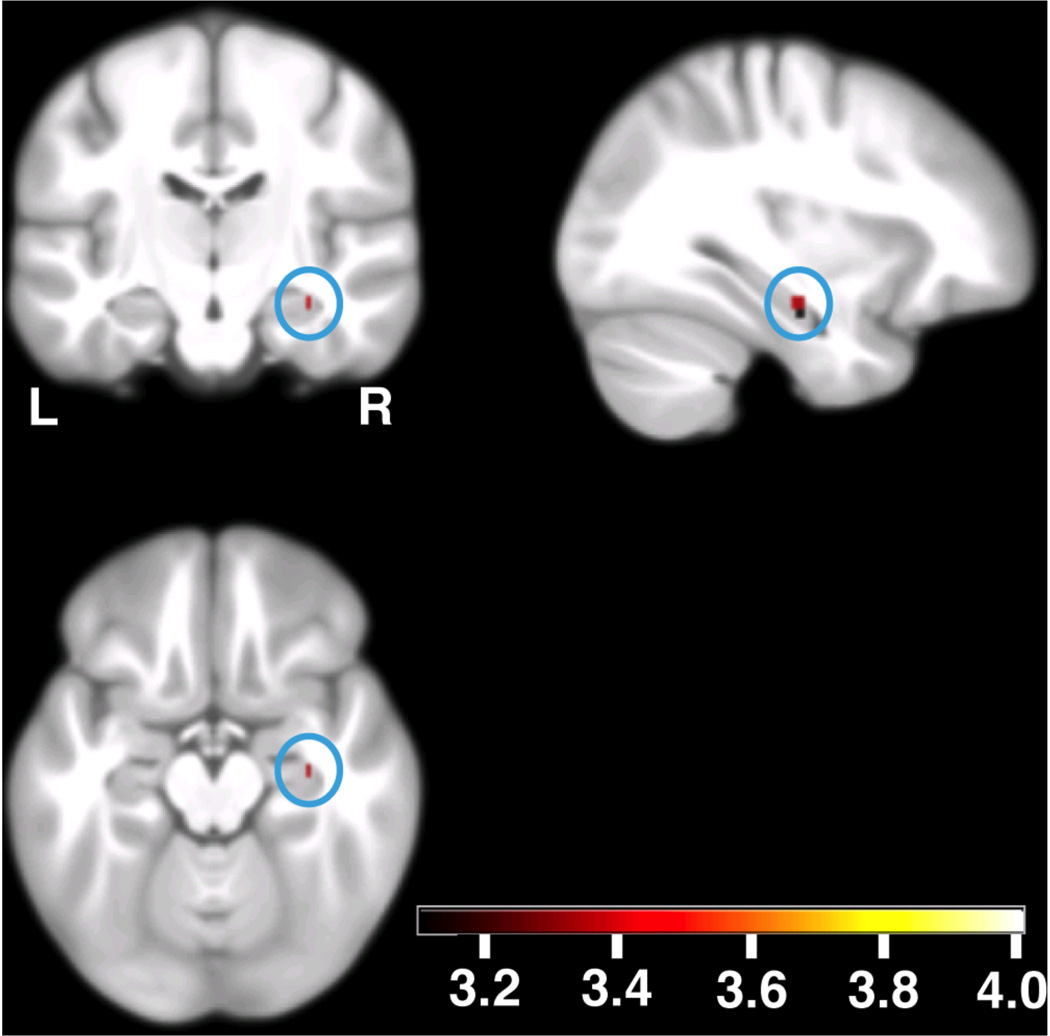
Fig. 2.
Allelic load-dependent increases in EM-related brain activity (n=1119). The blue circles show the activation in the right hippocampus. The local maximum is located at [33 −16.5 −16]; t=3.35, Puncorrected=0.0004, Psmall volume correction (SVC) < 0.05. Activations are overlaid on coronal (upper left), sagittal (upper right) and axial (lower left) sections of the study specific group template (see Methods); displayed at Puncorrected=0.001, using color-coded t values. L, left side of the brain; R, right side of the brain.

