Abstract
This report is an update of pancreas and kidney transplant activities in the US and non-US region in two periods, 2005-2009 and 2010-2014. The aim of the report was to analyze transplant progress and success in the US compared to non-US countries, and to compare trends between the two periods. Between 2005-2009 and 2010-2014, the number of US pancreas transplants declined by over 20%, while the overall number of pancreas transplants performed outside the US has increased. The decline in US numbers is predominantly due to the decline in primary and secondary pancreas after kidney transplants (PAK). During the time period studied, the number of PAK transplants dropped by 50%. In contrast, the number of simultaneous pancreas/kidney transplants (SPK) declined by only 10%, and the number of pancreas transplants alone (PTA) by 20%. Over 90% of pancreas transplants worldwide were performed, with a simultaneous kidney transplant and excellent results. Transplant outcomes in SPK improved significantly because of a decrease in the rates of technical and immunologic graft loss. In 2010-2014 vs. 2005-2009, US SPK transplant patient survival at 1 year post-transplant increased from 95.7% to 97.4%, pancreas graft function from 88.3% to 91.3%, and kidney function from 93.6% to 95.5%. A significant improvement was also noted in PAK transplants. One-year patient survival increased from 96.4% to 97.9% and pancreas graft function from 81.0% to 86.0%. PTA 1-year patient survival remained constant at 97%, and pancreas 1-year graft survival improved from 81.0% to 85.7%. With the decline in the number of transplants, a change towards better pancreas donor selection was observed. In solitary transplants, the donors were primarily young trauma victims, and the pancreas preservation time was relatively short. A general tendency towards transplanting older recipients was noted. In 2010-2014 vs. 2005-2009, PTA recipients 50 years of age or older accounted for 32% vs. 22%, PAK for 28% vs. 22%, and SPK for 22% vs. 20%. This may be due to a relatively lower immunologic graft loss rate, especially in solitary transplants, which historically has been high in young recipients. The number of pancreas transplants in patients with type 2 diabetes and end-stage renal disease has increased, and accounted for 9% of all SPK recipients in 2010-2014.
Keywords: diabetes, pancreas transplant, kidney, SPK, PAK, PTA, graft function, antibody induction
Abbreviations: AB antibody; ATGAM anti-thymocyte globulin sterile solution; BD bladder drainage; BMI body mass index; CCV cardio- or cerebrovascular problems; CI confidence interval; CMV cytomegalovirus; CNS central nervous system; CoD cause of death; CsA cyclosporin A; DCD donation after cardiac death; DD deceased donor; ED enteric drainage; eGFR estimated glomerular filtration rate; ESRD end-stage renal disease; GSR graft survival rate; HLA human leukocyte antigen; IPTR International Pancreas Transplant Registry; IS immunosuppression; LD living donor; LR log-rank; MM mismatch; MMF mycophenolate mofetil; NS non-significant; OKT3 orthoclone OKT3, monoclonal antibody against CD3 receptor; pDRI pancreas donor risk index; PAK pancreas after kidney transplant; PTA pancreas transplant alone; PRA panel-reactive antibody; rePAK PAK retransplant; RR relative risk; SPK simultaneous pancreas and kidney transplant; Srl sirolimus; TAC tacrolimus; Tx transplantation; UNOS United Network for Organ Sharing; WC Wilcoxon
1. Introduction
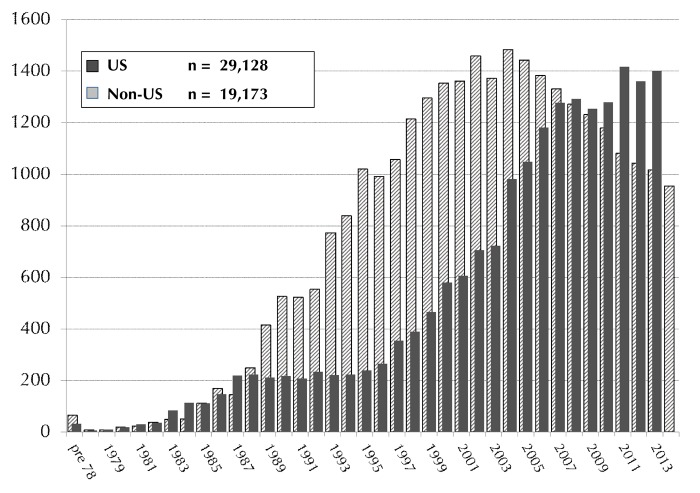
Pancreas or pancreas/kidney transplants are established procedures for patients with labile diabetes mellitus [1]. From December 16, 1966 to December 31, 2014 more than 48,000 pancreas transplants worldwide were reported to the International Pancreas Transplant Registry (IPTR), including more than 29,000 from the USA and more than 19,000 outside the US. The annual reported numbers of US and non-US cases are shown in Figure 1. Cases were closed for analyses on July 31, 2015. For non-US transplants, the reporting for 2014 cases at the time of closing was incomplete, and information from several countries was outstanding. At the time of writing, the reported numbers of transplants outside the US was, therefore, lower than the total number will be when all information will have been received by the registry.
Figure 1.
Annual number of US (1966-2014) and Non-US (1966-2013) pancreas transplants.
Additional information for countries that did not report or that provided only partial information was found on global websites or country-specific transplant registries. Several institutions outside the US are reporting outcomes directly to the IPTR. This information is not complete for the specific country. Therefore, outcomes are not reported. Information about US and non-US cases are given separately to avoid a bias due to the incomplete reporting.
In the US, pancreas transplant is an established standard of care for patients with brittle diabetes mellitus. The benefits, especially of simultaneous kidney and pancreas transplantation (SPK), are not questioned. The number of pancreas transplants reached its peak in 2004, and declined steadily from then on. In this report, we focused on the last decade when the number of transplants steadily declined, and divided this time frame into 2 eras: 2005-2009 and 2010-2014. The changes between the two eras are described, and their impact on outcome is studied. Also, an update of potential risk factors is given.
2. Methods
All pancreas transplants between January 2005 and December 2014 with follow-up information as of July 31, 2015 were included in the analyses. The analysis concentrated on patients who received a pancreas transplant because of insulin-dependent diabetes. The definition of pancreas graft failure is currently the focus of discussion. In this analysis, we followed the most recent UNOS recommendations for pancreas graft failure. These criteria include:
Having the graft removed or being relisted
Having died
Needing more than 0.5 units of insulin per kg per day over a 90-day period
In an increasing number of cases, pancreas recipients with an initial diagnosis of type 1 diabetes developed type 2 diabetes after some time with good graft function. The transplanted pancreas may have been functioning, but the recipients returned to insulin dependence over time. As a consequence, we used a more conservative definition of insulin independence for this analysis to determine pancreas graft function. Reports of partial graft function (requiring insulin), death with a functioning graft, or partially functioning graft were considered as reports of graft failure, if not stated differently.
In an additional analysis, early technical failures and pancreas transplants with a primary non-functioning graft were excluded (the remaining cases were considered technically successful transplants). In yet another analysis, patients who died with a functioning graft were censored at the time of death to assess the immunological impact on the outcome of the transplant. Early technical failures (during the first 90 days post-transplant) are primarily early graft losses attributed to graft thrombosis or graft removal because of bleeding, anastomotic leaks, pancreatitis, and/or infection.
Kidney grafts were considered to be functioning as long as the patients on dialysis before transplant were dialysis-free after transplant or as long as patients not on dialysis before transplant had a post-transplant serum creatinine level below the pre-transplant level.
There is variability in the type of antibody induction therapy given to pancreas transplant recipients. For analysis reasons, the agents were divided into two groups:
T-cell depletion (e.g., ATGAM, thymoglobulin, alemtuzumab, OKT3)
Non-T-cell-depleting antibodies (e.g., daclizumab, basiliximab)
B-cell-depleting antibodies (rituximab) were given only very rarely during the analyzed time period (<0.6%), and were thus not considered in the analysis.
In our analyses, we also studied the impact of center experience/volume on outcome. We defined a pancreas transplant center to be small, medium, or large corresponding to the number of transplants performed per year during a 5-year period, as follows:
Small center (performed on average less than 5 transplants)
Medium-size center (performed on average between 5 and less than 10 transplants)
Large center (performed on average more than 10 transplants)
P-values for comparison of survival rates were calculated by both Wilcoxon (WC) and log-rank (LR) test. The WC test primarily reflects the probability that early differences are significant, while the LR test is weighted to detect the significance of late differences. When both WC and LR p-values are <0.05, then the highest of the values is given. When both are >0.05, then the lowest of the values is given, or the differences are designated as non-significant (NS). When one p-value is < and one is >0.05, both are given. To assess the unbiased difference in outcome between the 2 eras only the first 3 years post-transplant were compared in both eras.
Cox proportional and non-proportional hazard models were used to investigate the independent influence of risk factors for patient survival and graft function. For the evaluation of patient survival dependent on graft status, graft failure times were added as time-dependent covariates to estimate the impact of graft failure on outcome.
All computations were performed using SAS version 9.4 (SAS Institute, Cary, NC).
3. Results of US transplants
The total number of pancreas transplants reported to IPTR/UNOS from December 16, 1966 to December 31, 2014 is 29,128 (Figure 1). During the last decade (1/1/2005-12/31/2014) a total of 11,940 patients received a pancreas transplant. The vast majority of these transplants (93%) were performed in patients with insulin-dependent diabetes mellitus as underlying disease. In 7% of patients, the pancreas was part of a multi-organ transplant in combination with a liver and/or an intestine. In these cases, the underlying disease was not related to diabetes (n = 818). Therefore, we excluded these patients from the analyses. There is also a small group of diabetic patients who received a pancreas transplant in combination with or after a heart or heart/lung transplant (n = 9). In 4 cases, the pancreas transplant was performed after a liver transplant, and in 2 cases it was performed after a lung transplant. Diabetes mellitus was the reason for transplant in those patients. These 15 cases were also excluded from further analyses.
During the last 10 years, only 5 pancreas transplants were segmental grafts from living donors (LD). Of the LD pancreas transplants, 2 were solitary transplants after a previous kidney transplant (PAK), and 3 transplants were in combination with a kidney from the same living donor (SPK). LD transplants were not included in the analyses summarized below, since this procedure is so rare and is only performed at 2 centers in the US. However, the registry can provide the following outcome information on the 5 LD cases: at 3 years: the patient survival and kidney graft survival rate (GSR) were both 100%; the pancreas GSR was 75%. One pancreas failed after 34 months because of immunologic graft loss.
Over the analyzed 10-year time period, 33 SPK transplants were reported. In these cases, the patients received an LD kidney simultaneously with a pancreas transplant from a (different) deceased donor (DD) in the same procedure.
3.1 Centers and volume
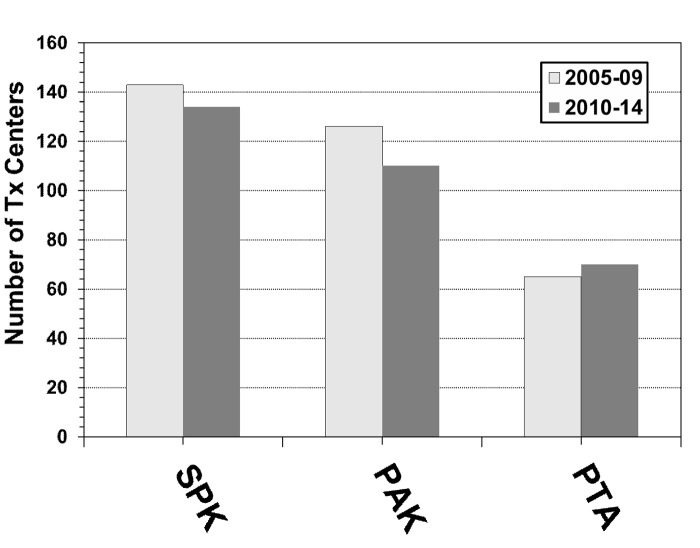
The number of US centers performing pancreas transplants overall had its peak in 2007, with 132 active transplant centers, and its low point in 2014, with only 114 active centers. The number of centers performing SPK transplants declined only slightly during the 2 eras (Figure 2). Almost all of the transplant centers performed at least one SPK. The number of centers performing PTA is still low. Only 30% of all active pancreas transplant centers performed a PTA in 2014, but, in contrast to SPK and PAK centers, an increase in the number of centers performing at least one PTA was noticed. The number of centers performing PAK transplants significantly declined during the 2 eras (Figure 2). In 2005, 83 transplant centers performed a PAK, but only 45 centers reported this procedure in 2014.
Figure 2.
Number of US transplants centers for SPK, PAK and PTA for 2005-2009 and 2010-2014.
Seventy percent of the centers performed fewer transplants in 2010-2014 than in 2005-2009. On average, the overall number of transplants declined by 8 pancreas transplants per center during 2010/14 (range of change: +67 to -202 transplants). The number of high-volume centers declined with the decreased number of pancreas transplants. The number of centers performing at least 100 pancreas transplants dropped from 14 centers (10%) in 2005-2009 to 9 centers (7%) in 2010-2014. At the same time, the number of very-low-volume centers (≤10 transplants in 5 years) increased from 36 centers (25%) in 2005-09 to 42 centers (31%) in 2010-2014.
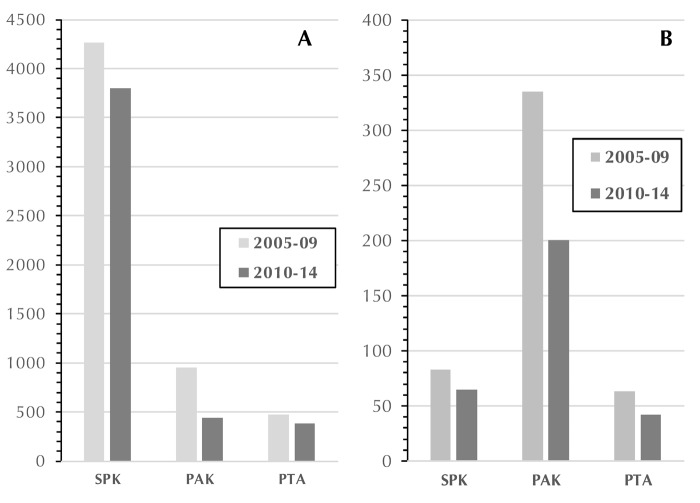
Between 2005-09 and 2010-2014, the number of transplants decreased overall by 20%. During the 2 eras, the highest decline was found in primary PAK (Figure 3A), where the number of transplants decreased by 54%, followed by primary PTA (19%) and primary SPK (11%).
Figure 3.
Number of US primary pancreas transplants (A) and US pancreas re-transplants (B) in 2005-2009 and 2010-2014.
Most of the retransplants were PAKs. A pancreas retransplant was performed after a failed SPK pancreas graft and a still functioning SPK kidney. The number of solitary re-transplants (PAK and PTA) decreased by 40% and 32%, respectively, and the number of re-SPK transplants decreased by 22% (Figure 3B) between the 2 periods.
3.2 Recipient characteristics for eras
For the last decade, a total of 11,104 pancreas transplants were reported in the 3 major categories (SPK, PAK, and PTA). Overall, SPK was the most frequently performed transplant category (74%) followed by PAK (17%) and PTA (9%).
In total, there were 7% retransplants (n = 789) during this time. Most of the retransplants were second transplants (92%). Third (n = 54) or fourth pancreas transplant (n = 10) was only very rarely performed. The majority of pancreas retransplants were PAK (68%), with a retransplant of a pancreas and a previous kidney graft still functioning.
Over the decade, a shift in the distribution of transplant types was noted (p < 0.0001). The rate of SPK transplants increased, while the rate of PAK transplants decreased. The rate of PTA remained relatively constant. The overall rate of primary SPK transplants increased from 75% in 2005-2009 to 82% in 2010-2014. In contrast, the number of primary PAK transplants decreased from 17% to 10% in 2010-2014. The rate of PTA remained constant at around 8% over this period. The overall rate of retransplants changed between the 2 eras (p = 0.002) because of a decrease in PAK retransplants (rePAK) from 70% in 2005-2009 to 65% in 2010-2014.
In both eras, the majority of recipients reported type 1 diabetes as reason for the pancreas transplant (Table A1, in the Appendix). The rate of type 2 diabetes increased significantly in SPK from 6% to 9% (p < 0.0001). The rate of type 2 diabetes remained stable in solitary transplants (PAK, PTA), but was significantly lower in comparison to SPK transplants (p < 0.0001). The number of pancreas transplants for other reasons (mostly after pancreatectomy) remained constant over the eras, and accounted only for a very small percentage of all transplants (Table A1).
Table A1. Characteristics for primary deceased donor pancreas transplant recipients, transplanted 2005-2009 and 2010-2014.
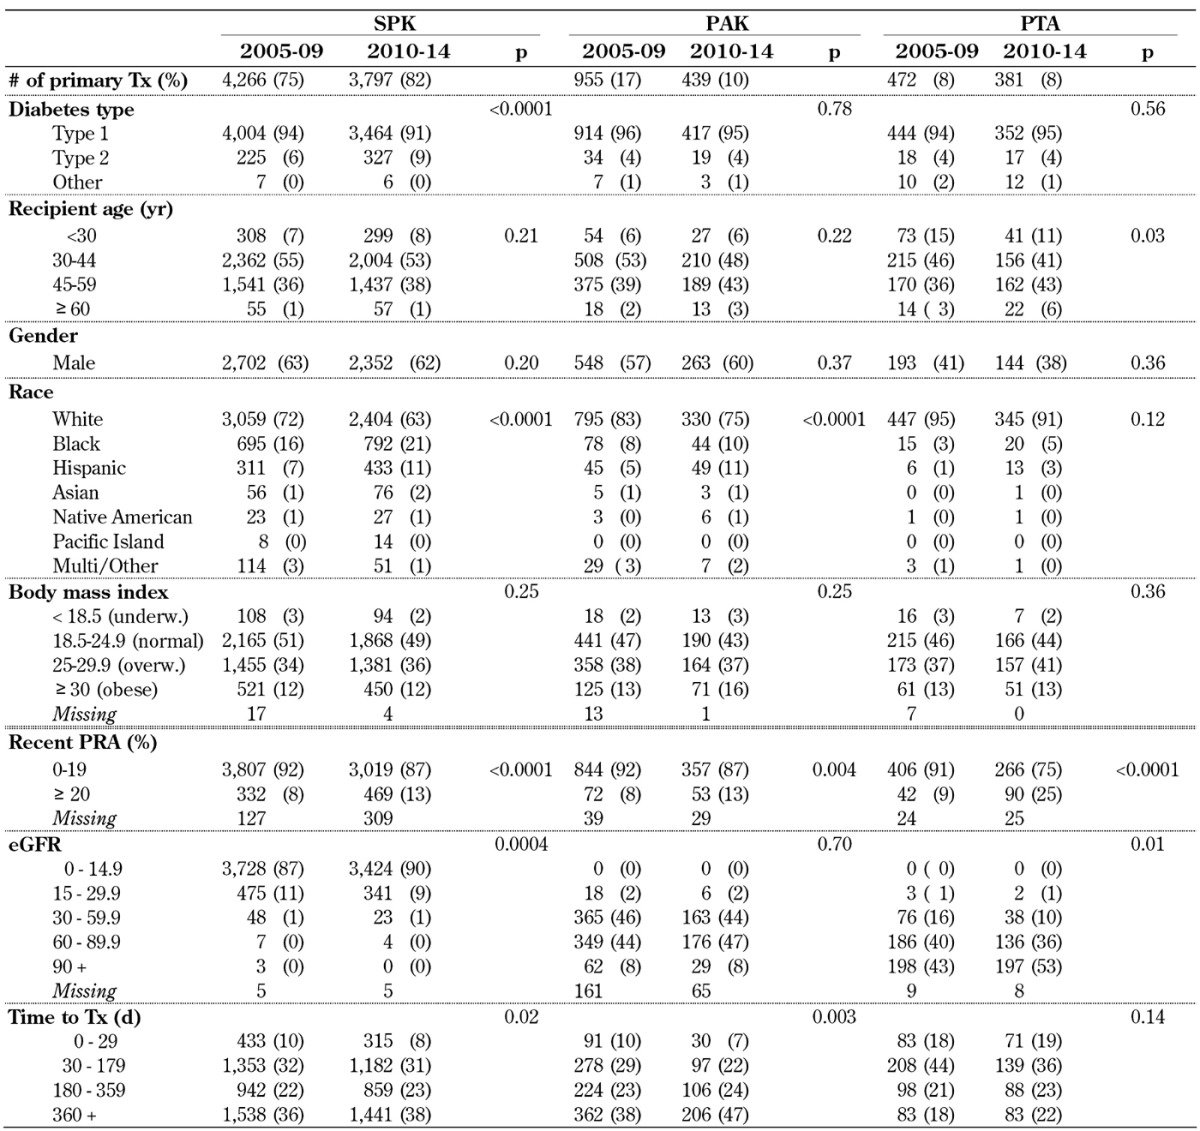
Legend: eGRF – estimated glomerular filtration rate, PAK – pancreas after kidney transplantation, PRA – panel reactive antibody, PTA – pancreas transplantation alone, SPK – simultaneous pancreas kidney transplantation, Tx – transplantation.
Over the 2 eras, recipient age at transplant showed a trend to older age, especially in solitary pancreas transplants, but there was a statistically significant difference for PTA only. In PTA, the median recipient age increased from 41 years to 44 years. In 2010-14, almost half of the recipients of a solitary transplant were 45 years or older. The rate of patients under 30 years of age continued to be low; the rate remained stable in SPK and PAK transplants with 6-8% of all recipients. The highest rate of recipients under 30 years of age remained in the PTA category, with over 10% of recipients. Overall, the average age of solitary transplants was significantly older than the age of SPK transplants (p < 0.002).
The rate of male/female recipients in SPK and PAK remained constant over the 2 eras; male recipients (~60%) received a pancreas transplant more frequently than females (p < 0.0001). In contrast, the rate of female PTA recipients was still significantly higher in both eras (~60%).
The majority of pancreas transplant recipients were white, but the rate of minorities who received a pancreas transplant increased significantly in the SPK and PAK category (Table A1). The largest increase could be seen in black and Hispanic recipients in the SPK category. In 2010-14, 37% of the SPK recipients were reported to be of minority origin. In 2010-14, solitary transplants were less frequently performed in minorities (25 % of PAK and 9% of PTA).
In all 3 pancreas transplant categories, increasing recipient body weight at the time of transplant was observed. Half of all recipients in all 3 categories were either overweight or obese. In the SPK transplant category, the increase in BMI over time was significant (p = 0.03); the same trend was also noted in solitary transplants.
The rate of sensitized recipients with panel-reactive antibody (PRA) levels 20% or over increased significantly in all 3 categories over time. The highest increase could be seen in PTA, where the rate of recipients with increased levels more than doubled (Table A1).
The rate of SPK recipients who received a preemptive kidney transplant together with the pancreas decreased significantly from 12% in 2005-09 to 10% in 2010-14 (p = 0.001).
The number of PAK recipients who received a kidney from a living donor also changed over time. Almost 80% of all primary PAK recipients had received a previous living donor kidney (p = 0.005).
In solitary transplants, good kidney function at the time of transplant is essential. In PTA, a significantly improved estimated glomerular filtration rate (eGFR) of the native kidney could be observed in 2010-14 (p = 0.02). The same trend could be found for the PAK kidney graft at the time of the pancreas transplant.
The time on the waitlist for those recipients who actually received a transplant increased in all 3 categories. The median wait-time for PAK transplant increased from 8.5 months in 2005-09 to 10.5 months in 2010-14; PTA wait-time increased from 3.8 months to 4.9 months. The median time on the waitlist for SPK transplant increased from 7.8 months to 8.4 months. Comparing the wait time between the 3 groups for 2010-14, the time on the waitlist was shortest for PTA and longest for PAK transplant (p < 0.0001).
3.3 Donor characteristics
The age of the deceased pancreas donor continued to decrease over time (Table A2, in the Appendix). The majority of pancreas donors were young: in 2010-14, 74% of all SPK donors were under 30 years (p < 0.0001). During the analyzed time, the youngest SPK donor was 1 year old, the oldest was 61 years. The donor age distribution of solitary transplants showed the same trend. The rate of donors under the age of 30 years was 79% in PTA and 78% in PAK transplant in 2010-14. Comparing donor age between the 3 categories in 2010-14, the donor age for SPK transplants was significantly higher than the donor age in solitary transplants (p < 0.02).
Table A2. Deceased donor (DD) characteristics for pancreas transplants, 2005-2009 and 2010-2014.
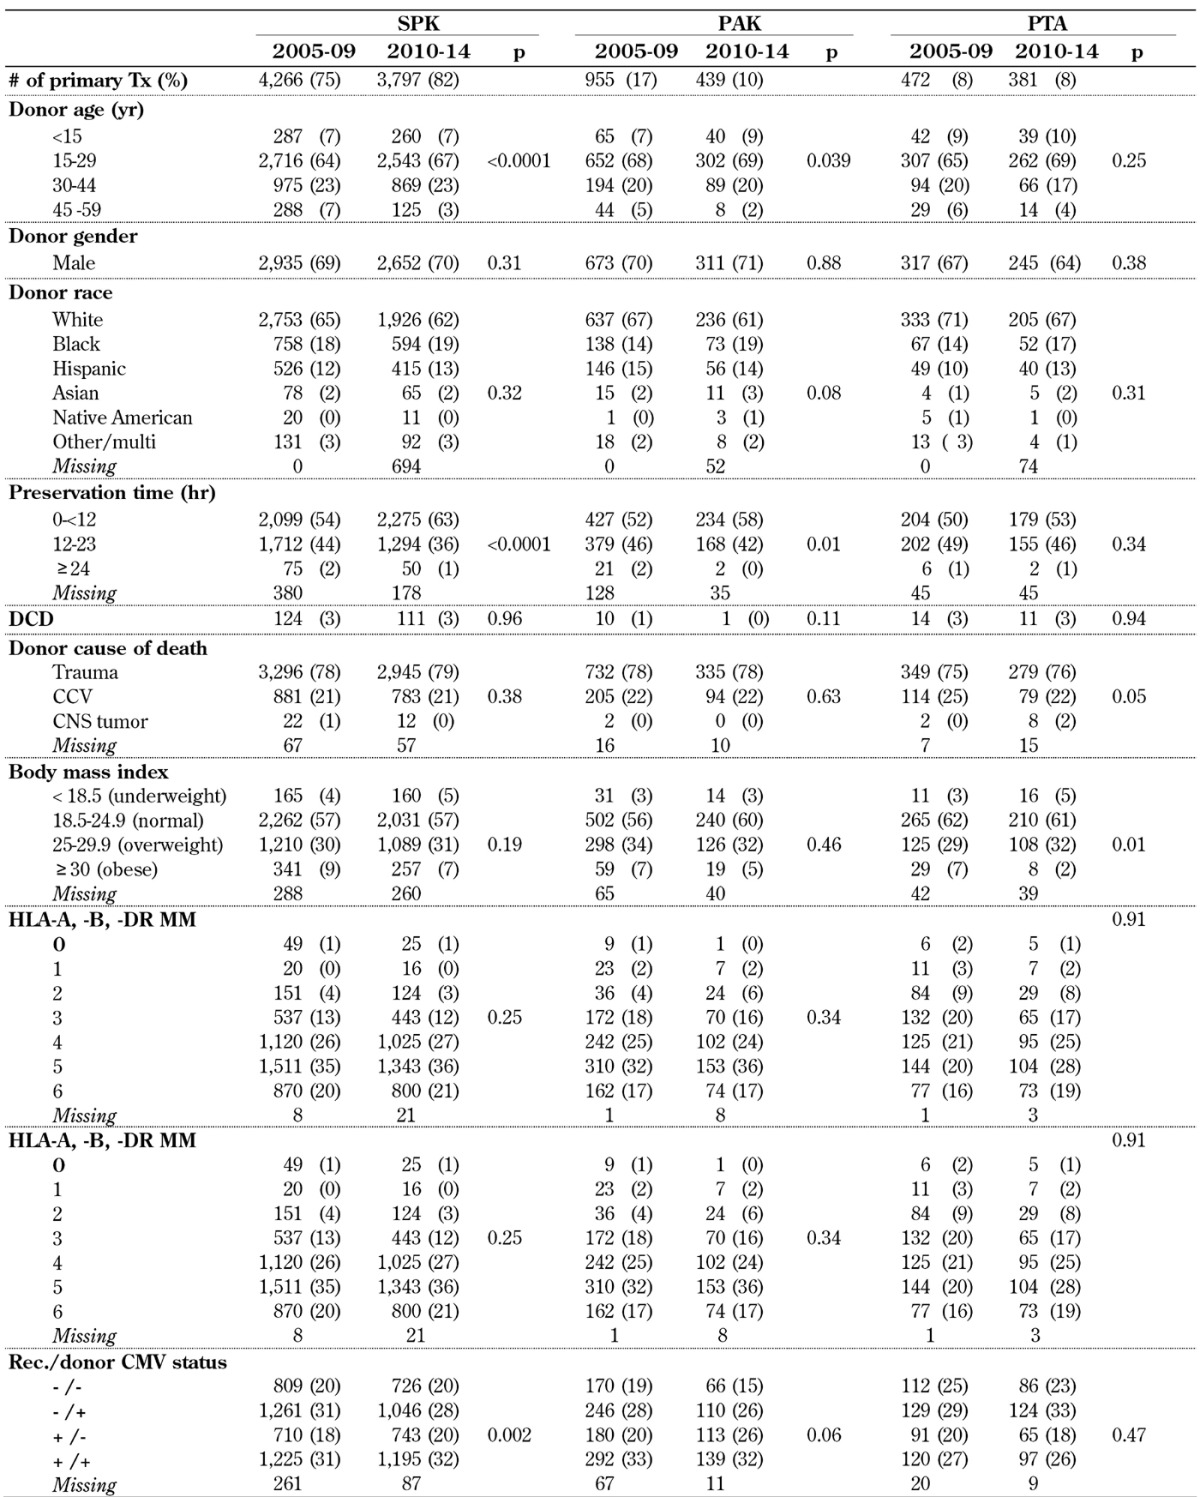
Legend: CCV – cerebro-cardiovascular, CMV – cytomegalovirus, CNS – central nervous system, DCD – donation after cardiac death, HLA – human leukocyte antigen, PAK – pancreas after kidney transplantation.
The rate of male/female donors remained constant over time in all 3 transplant categories (p > 0.31). The majority of deceased donors were male, accounting for ~70% of all donations. In all 3 categories, the majority of donors were white (Table A2). However, a significant shift in the rate towards more minority donors could be noted in all 3 categories.
The rate of trauma as cause of donor death increased significantly over time in SPK and PAK transplants, and remained stable in PTA. Donations after cardiac death (DCDs) were only rarely accepted. No change in the rate of the use of DCD could be found in SPK transplants and PTA. Only 1 DCD donor was used in a PAK transplant in 2010-14.
Donor weight did not change over time. The majority of donors chosen for transplantation had normal BMIs in all 3 categories (Table A2).
Regarding human leukocyte antigen (HLA) matching, there has been a progressive decrease in the emphasis over time in all 3 categories (Table A2). In 2010-14, 57% of SPK transplants, 53% of PAK transplants, and 47% of PTA reported to have 5 or more HLA-A, -B and -DR mismatches (MM). Only 0.7% of all transplants were done with a 6 antigen match in 2010-14.
The cytomegalovirus (CMV) status of recipients changed, especially in SPK, over time (p < 0.002). In 2005-09, 48% of SPK transplants, 53% of PAK transplants, and 46% of PTA tested CMV-positive at the time of transplant. In comparison, 52% of SPK transplants, 59% of PAK transplants, and 43% of PTA tested positive in 2010-14. This change was significant in SPK and PAK. The rate of donors with a positive CMV test remained relatively constant over time (Table A2). In SPK and PAK, the rate of CMV-negative recipients and CMV-positive donors decreased, while the rate of CMV-positive recipients and CMV-negative donors increased.
Pancreas preservation time decreased significantly in SPK and PAK. In 2010-14, overall 62% of all transplants had a preservation time of less than 12 hours, and only 1% reported a preservation time of over 24 hours. A comparison of preservation times in all 3 categories showed a slightly longer preservation time for PTA compared to SPK (p < 0.0001) because of the higher rate of organ imports.
The improvement in pancreas donor quality is reflected in the pancreas donor risk index (pDRI), which significantly decreased over the analyzed time period (p < 0.0001), and which was significantly lower for solitary transplants (p < 0.0001).
3.4 Transplant characteristics
With the change in center volume, the number of transplants performed at large centers changed in the SPK category (Table A3, in the Appendix). In 2010-14, 30% of SPK transplants were performed in 12 large-volume centers (8% of centers). In contrast, 48% of SPK transplants were performed at 115 low-volume centers (78% of all centers). In the PTA category, the numbers remained stable, but PTA transplants were more likely to be performed at one of the 12 large-volume transplant centers.
Table A3. Transplant characteristics for primary deceased donor pancreas transplants, 2005-2009 and 2010-2014.
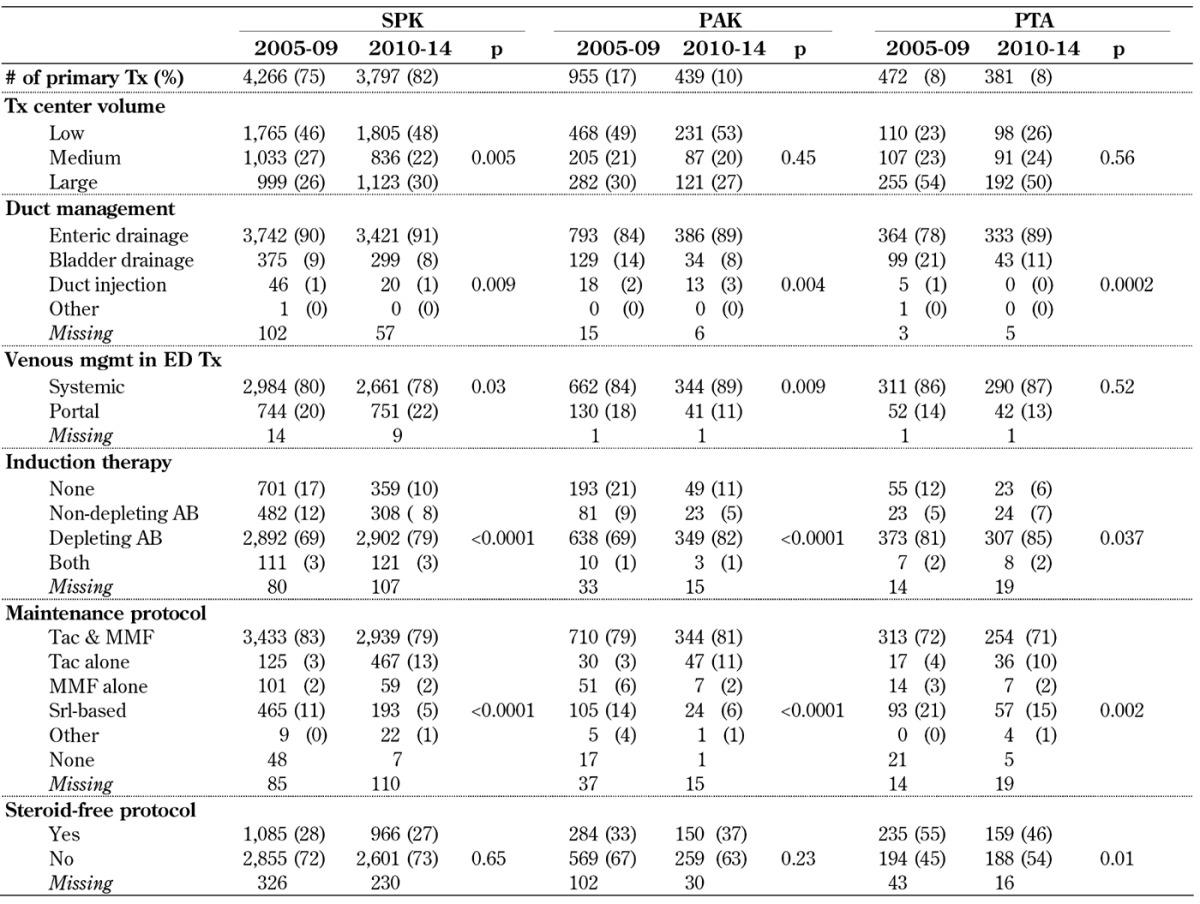
Legend: AB – antibody, ED – enteric drainage, MMF – mycophenolate mofetil, PAK – pancreas after kidney transplantation, PTA – pancreas transplantation alone, SPK – simultaneous pancreas kidney transplantation, Srl – sirolimus, Tac – tacrolimus, Tx – transplantation.
Enteric drainage (ED) is now by far the most frequently used technique in SPK and solitary pancreas transplant. In 2010-14, 91% of SPK transplants, 89% of PAK transplants, and 89% of PTA were enterically drained (Table A3). While the increase was not as large in SPK transplants, the increase was more extensive in solitary transplants. The rate of ED transplants using a Roux-en-Y loop significantly decreased in PAK transplants from 21% to 15%, in SPK from 25% to 21%, and in PTA from 21% to 15% in 2010-14 (p < 0.05).
The use of portal drainage of the ED pancreas graft venous effluent slightly increased in SPK over time. It remained relatively constant in PTA, but significantly declined in PAK (Table A3). Overall, portal drainage was more frequently used in SPK than in solitary transplants.
Induction therapy changed significantly in all 3 categories over time (Table A3). The rate of transplants without induction therapy decreased significantly in 2010-14 in SPK from 17% to 10%, in PAK from 21% to 11%, and in PTA from 12% to 6%. At the same time, the use of non-depleting antibodies alone or in combination with depleting antibodies dropped. Depleting antibodies were used for induction therapy in 80% or more of all pancreas transplants.
For maintenance therapy, the major protocol for successful pancreas transplants is still tacrolimus (TAC) in combination with mycophenolate mofetil (MMF) therapy (Table A3). The use of TAC alone without MMF increased in SPK transplants from 3% to 13% and in PTA from 4% to 10%. Cyclosporin A (CsA)-based protocols are rarely used, as is the case with protocols based on MMF alone. Sirolimus-based protocols were less frequently used in SPK and PAK, but accounted for 15% of all PTAs in 2010-14.
The use of steroid-free maintenance protocols did not change in SPK and PAK over time. In SPK and PAK, 67-73% of the recipients remained on steroids for maintenance therapy. In PTA, a change from 54% to 46% of recipients on a steroid-free maintenance therapy protocol was noted between 2005-09 and 2010-14 (p = 0.01). The rate of patients on a steroid-free protocol at 6 months post-transplant decreased slightly to 43% in PTA, 36% in PAK, and 24% in SPK recipients in 2010-14.
3.5 Patient survival
Unadjusted patient survival after pancreas or simultaneous pancreas and kidney transplant was excellent with over 98% at 6 months post-transplant in all 3 recipient categories in 2010-14. One year patient survival rates have been over 95% in 2005-09 and over 96% in 2010-14 (Table A4, in the Appendix). The improvement reached statistical significance only in the SPK category, but improved survival was also noted in the PAK and PTA categories.
Table A4. Patient survival after primary deceased donor pancreas transplants, 2005-2009 and 2010-2014.

Legend: PAK – pancreas after kidney transplantation, PTA – pancreas transplantation alone, SPK – simultaneous pancreas kidney transplantation, Tx – transplantation.
Five-year patient survival could only be computed for recipients transplanted in 2005-09. It showed the same survival for SPK and PTA, followed closely by PAK patient survival (Table A4). There was no difference in overall long-term patient survival between the 3 categories in 2005-09 (p = 0.99) and also for a shorter follow-up time in 2007-11 (p = 0.90).
In all 3 categories and in both eras, cardio- or cerebro-vascular problems (CCV) and infections in general were the leading causes of early and late recipient death. Independent of time of death, CCV were responsible for 31% of death cases followed by 24% due to infections. In 21% of deaths, the causes were unknown. Hemorrhage was the cause in 6% of all deaths, followed by malignancies in 4% of all cases.
CCV and infections were seen most frequently in the first 3 month post-transplant, but also remained the main causes of death later on. In all 3 categories, the rate of CCV- and infection-related death did not change over time. The risk to die from hemorrhage was initially high, but decreased over time in all 3 categories. The early rate of malignancies was low, but accounted for 6-9% of all death cases later than 1 year post-transplant.
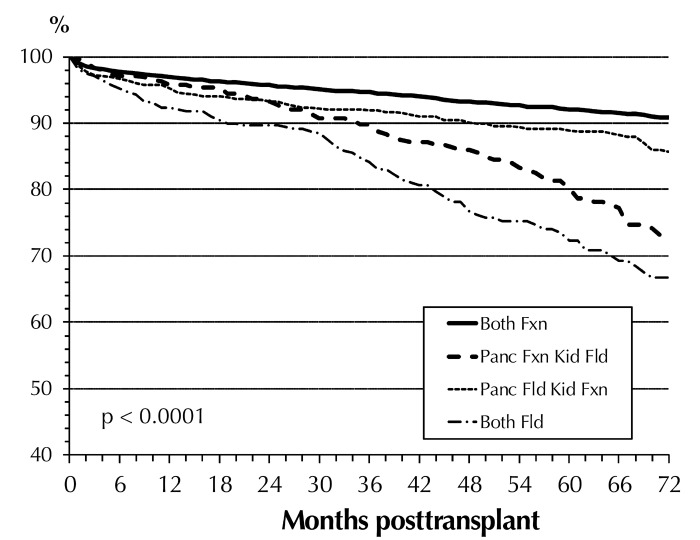
Table A5 (in the Appendix) shows the multivariate risk factor analysis for patient survival in the 3 transplant categories during the first 3 years post-transplant. A significant improvement in outcome of SPK transplants was found between 2010-14 and 2005-09; this was not the case for solitary transplants. The status of the transplanted graft had the highest overall impact on patient survival. A failed pancreas and/or kidney graft significantly increased the relative risk (RR) to die in all 3 categories. A failed SPK kidney graft increased the RR to die by factor 18, and a failed SPK pancreas graft by factor 3. In a recipient with a failed PTA graft, the RR to die was over 6 times higher; with a failed PAK graft almost 5 times higher. Figure 4 illustrates the significant impact of a functioning/failed pancreas and kidney graft on SPK patient survival and the impact over time. These findings emphasize the need for, and the positive impact of, a functioning kidney graft on long-term patient survival.
Table A5. Relative risk (RR) for patient death for primary deceased donor (DD) pancreas transplants, 2005-2009 and 2010-2014.
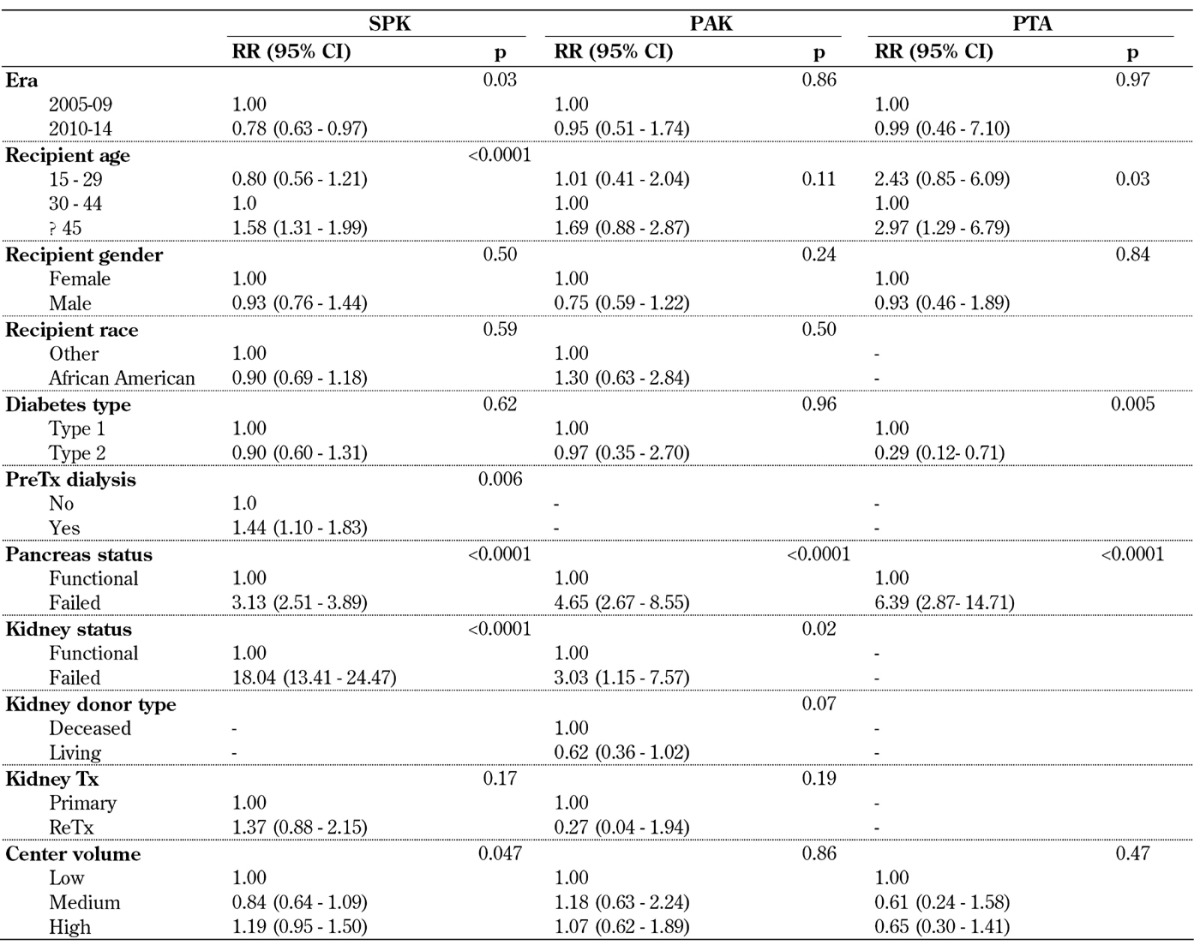
Legend: CI – confidence interval, PAK – pancreas after kidney transplantation, PreTx dialysis – dialysis prior to transplantation, PTA – pancreas transplantation alone, RR – relative risk, SPK – simultaneous pancreas kidney transplantation, Tx – transplantation.
Figure 4.
SPK patient survival for primary deceased donor transplants by pancreas and kidney graft status, 2005-2014. Abbreviations: Fxn – functional, Fld – failed, panc – pancreas.
In all 3 categories, recipients 45 years of age or older carried an increased risk to die after transplant compared to 30-45 year old recipients as reference (Table A5). Young SPK recipients, in contrast, had a statistically better outlook after transplant. In contrast, younger PTA recipients had an increased risk compared with the reference age group. For PAK transplants, the risk in younger recipients was not increased.
In all 3 categories, the RR to die was slightly lower in male recipients, but this was not significant. African American recipients showed the same outcome as the remaining recipients. It is noteworthy that the RR was significantly higher for SPK recipients who were on dialysis before transplant compared to those who received a preemptive kidney transplant. Diabetes type did not impact patient survival in SPK and PAK recipients, but it did in PTA. The RR to die was significantly decreased in PTA recipients with type 2 diabetes.
The donor type of the previous kidney transplant had an impact on patient survival in PAK recipients. Recipients who received a kidney from a living donor reduced their relative risk to die by 38% (Table A5).
An overall effect of center volume on patient survival could not be found. Patient survival was slightly better in PTA in medium- and high-volume centers, but this was not significant.
3.6 Graft function
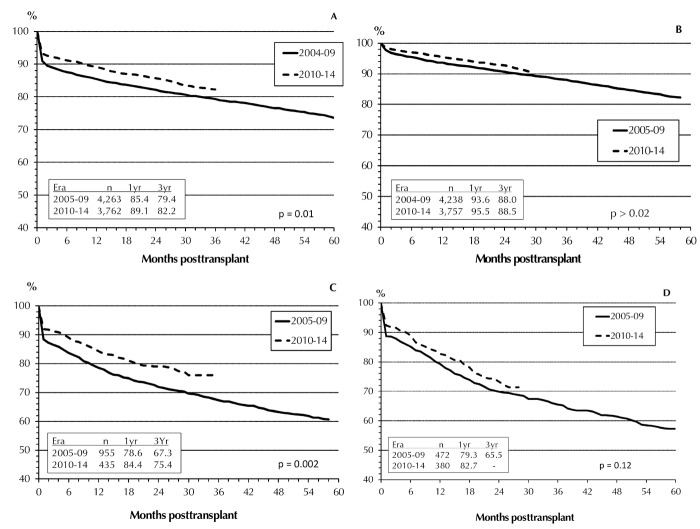
Overall, pancreas graft survival rates (GSRs) improved in all 3 categories between the 2 eras (Figure 5). While the improvements during the first 3 years post-transplant for both SPK grafts and PAK grafts were statistically significant (p < 0.01), the changes in PTA graft survival did not reach significance (p = 0.12). In both eras, SPK pancreas GSRs were significantly higher than those for solitary transplants (p < 0.0001). While in 2005-09 no difference in GSRs between PAK and PTA (p > 0.13) was found, there was a significant improvement in PAK in 2010-14. This later improvement provides a convergence of the outcomes in PAK and SPK. For the first 6 months, the results in graft survival were comparable, but at one year, the outcome in SPK was still clearly better than that in solitary transplants. In 2010-14, the outcome in PAK at 2 years post-transplant was with 79.1% significantly better than in PTA with 73.3% (p = 0.01).
Figure 5.
Primary deceased donor (DD) graft function, 2005-2009 and 2010-2014. SPK pancreas graft (A), SPK kidney graft (B), PAK pancreas graft (C), PTA pancreas graft (D).
The causes of pancreas graft loss and their distributions post-transplant were different between the 3 categories, and changed during follow-up post-transplant.
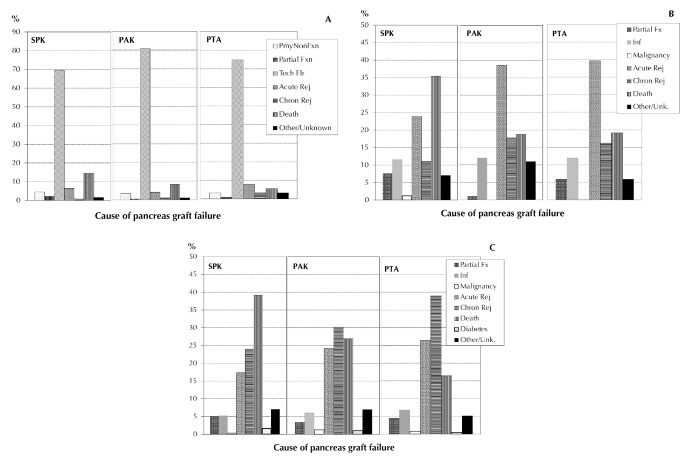
Figure 6A shows the distribution of causes for pancreas graft loss during the first 3 months post-transplant in all 3 categories for primary transplants between 2010 and 2014. Graft loss due to early technical problems was predominant in all 3 categories. The second most frequent reason for pancreas graft failure in SPK was dying with a functioning graft. While the rate of dying with a function graft was higher in SPK, the rate of technical losses was lower compared with solitary transplants. No difference in the rate of acute or chronic immunologic graft loss was noted between the 3 categories in this time period. The rate of primary non-functioning graft accounted for around 4% in all 3 categories.
Figure 6.
Causes of pancreas graft failure for transplants performed between 2010 and 2014, 0 to <3 months transplant (A), 3 to < 12 months posttransplant (B), and 1 to 5 years posttransplant (C). Abbreviations: Chron – chronic, Flr – failure, Fx – function, Fxn – functional, Pmy – primary, Rej – rejection.
Between 3 months and 1 year after transplant, death with a functioning graft becomes the most frequent reason for graft failure in SPK (Figure 6B). The rate of graft loss due to acute immunological problems peaked in the category of solitary transplants, and presented the main problem there. The rate of chronic immunological graft loss increased, especially in solitary transplants, during this time period. Infections also remained a problem, accounting for around 12% of graft losses in all 3 categories.
After the first year post-transplant, dying with a functioning graft was the main reason of graft loss in over 40% of recipients in the SPK category (Figure 6C). The rate of dying with a functioning graft was clearly lower in solitary transplants. In contrast, the rate of immunologic graft loss was clearly higher in solitary transplants, and remains a problem for solitary transplants. Any type of diabetes recurrence or malignancy accounted only for a small percentage of graft losses during that period.
If dying with a functioning graft was not counted as graft failure, the SPK pancreas GSR increased to 88.3% at 1 year and 83.4% at 3 years; for PAK and PTA, the changes in GSR were small because the rate of recipients dying with a functioning graft was small. When only recipients who reached the 1-year mark with a functioning graft were considered (conditional function), the 3-year GSR increased to 95% in SPK, 92% in PAK, and 84% in PTA.
The improvement in graft outcome is also reflected in the estimated half-lives for pancreas transplants. The half-life for a primary SPK pancreas performed between 2000 and 2008 was 152 months. The half-life for a pancreas transplant that functioned at the 1-year mark (conditional half-life) reached 173 months. The half-life of the simultaneous SPK kidney was 186 months, with a conditional half-life of 203 months. The half-life of a PAK pancreas graft was 96 months, but the conditional half-live was 166 months, very similar to the SPK pancreas. For a PTA pancreas graft, the half-life was 81 months, and the conditional half-life 123 months. The significant improvement in pancreas graft half-lives over time is one of the greatest achievements in this field.
Multivariate risk factor analyses for overall SPK graft function showed a significant improvement in pancreas GSR and kidney GSR in 2010-14. Pancreas and kidney grafts were associated with a significantly increased risk of graft loss in younger recipients (Table A6, in the Appendix). The outcome in male SPK recipients was significantly better, but obesity and an increased PRA level accounted for an increased risk of pancreas and loss of kidney graft. African American had an increased risk for the kidney graft only. Pre-transplant dialysis impacted the outcome of the kidney graft only.
Table A6. Overall relative risk (RR) for pancreas and pancreas/kidney graft failure for primary deceased donor (DD) pancreas transplants, 2005-2009 and 2010-2014.
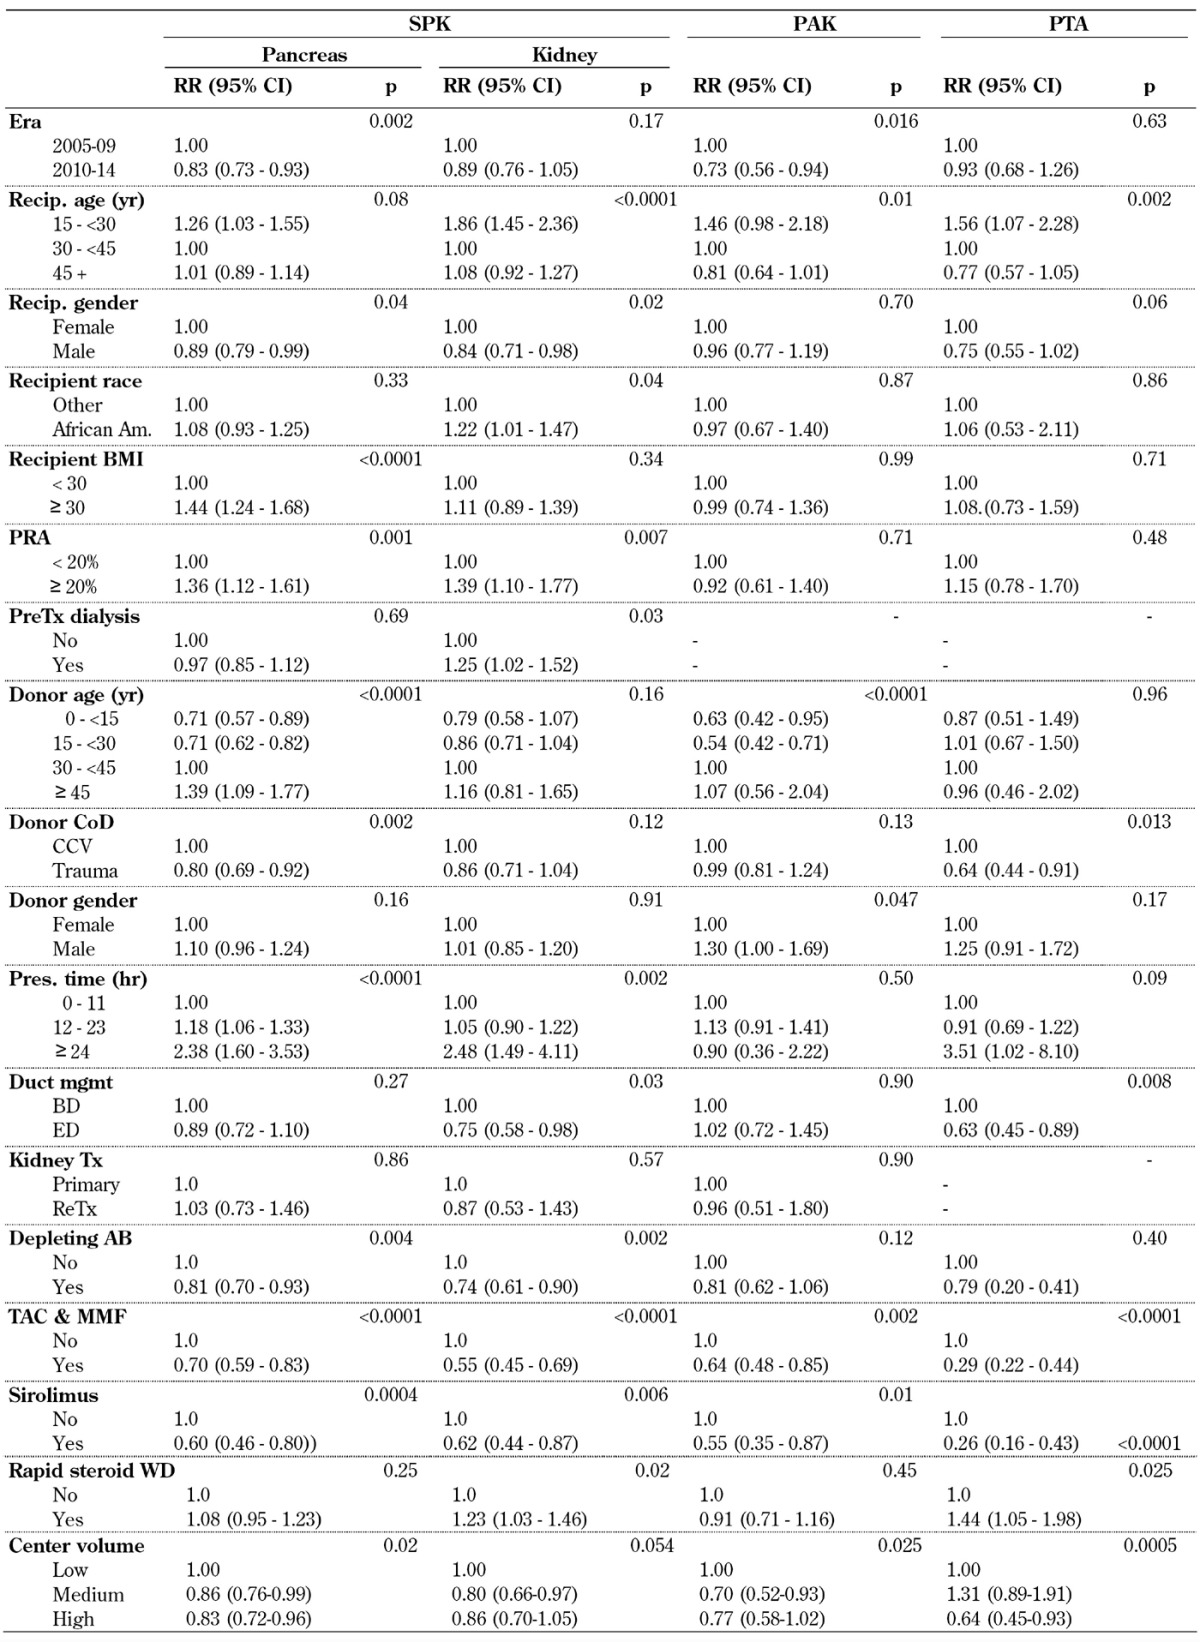
Legend: AB – antibody, BMI – body mass index, CCV – cerebro-cardiovascular, CI – confidence interval, CoD – cause of death, mgmt – management, MMF – mycophenolate mofetil, PAK – pancreas after kidney transplantation, PRA – panel reactive antibody, PreTx dialysis – dialysis prior to transplantation, PTA – pancreas transplantation alone, RR – relative risk, SPK – simultaneous pancreas kidney transplantation, Tac – tacrolimus, Tx – transplantation, WD – withdrawal.
The analyses showed that the donor selection and management process is essential for the outcome in SPK transplant. Older donors, cardio-cerebrovascular cause of death and extended preservation times were associated with significantly higher rates of graft loss. This effect was more extensive in the pancreas graft, and had a lower impact on the kidney graft.
The type of duct management had no impact on pancreas outcome, but enteric drainage in SPK transplants provided significantly better kidney function.
A previous kidney transplant in SPK or more than one previous kidney transplant in PAK had no impact on pancreas graft outcome.
The analyses showed that the use of depleting antibody therapy for induction, TAC in combination with MMF and sirolimus-based immunosuppressive protocols for maintenance, were preferable. A steroid-free protocol showed no impact on outcome for the SPK pancreas graft, but was associated with a significantly increased risk of SPK kidney graft loss (Table A6).
Center volume had a significant impact on both pancreas and kidney GSR. The results in medium- to high-volume centers were better than in low-volume centers.
A similar impact of the different risk factors could be found in solitary pancreas transplants. The risk of graft loss decreased with increasing recipient age. The RR to lose the graft was almost 60% higher in recipients under 30 years of age and 23% lower in recipients over 45 years of age compared to the 30 to <45 age group.
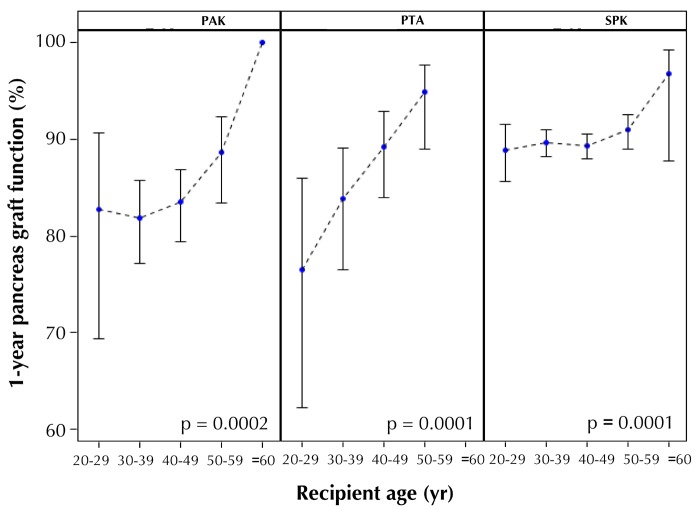
Figure 7 shows a subanalysis of type 1 diabetes recipients with depleting antibody induction therapy and a maintenance protocol of TAC in combination with MMF and age at transplant. This analysis shows the positive correlation between age at transplant and 1-year pancreas graft function. This effect was much more pronounced in solitary transplants and less evident in the SPK category.
Figure 7.
One-year pancreas graft function with 95% confidence intervals by recipient age for recipients with type 1 diabetes with induction therapy and maintenance with TAC and MMF.
When only patients with graft function at one year were included in the Cox-regression analysis, the impact of the different risk factors changed. The only remaining significant factor for improved SPK pancreas graft function was the usage of depleting antibody induction therapy, which reduced the RR by 31%. Younger age remained a risk factor, but with much less impact (p = 0.08). For SPK kidney graft, young age remained the most significant risk factor, with an increased RR of 1.76 (p = 0.001). Male recipients had a significantly better outcome than female recipients (RR = 0.72, p = 0.001). The maintenance protocol of TAC and MMF reached significance with a RR of 0.66 (p = 0.02). In functioning solitary pancreas transplants at one year post-transplant, the most significant factor remaining was again young age, which significantly increased the risk for graft loss. It was noteworthy that the risk significantly decreased in enteric drained PTA, with an RR risk reduction of >50%.
3.7 Early technical failures
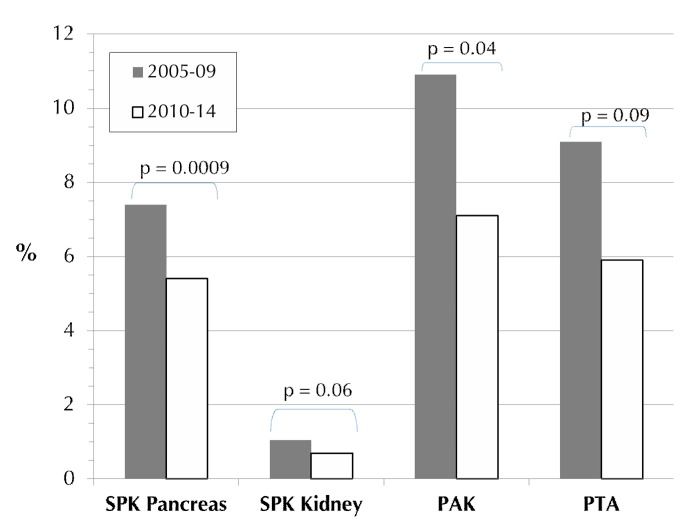
Between 2005-09 and 2010-14, the incidence of technical failure decreased significantly in all 3 categories (Figure 8). The technical failure rates for solitary transplants in 2005-09 were significantly higher than for SPK (Table A7, in the Appendix); this difference was not significant in 2010-14. The difference between SPK and solitary transplants may be due to a higher number of misclassifications of early immunologic graft loss, falsely declared as technical failure (graft thrombosis). Of interest is the small technical SPK kidney graft loss rate in comparison to the SPK pancreas (Figure 8). A reduction in the rate of kidney graft technical failures was also noted (p = 0.06).
Figure 8.
Rate of early technical failures in deceased donor primary pancreas transplants for the major recipient category, 2005-2009 and 2010-2014.
Table A7. Reasons for early technical failures for bladder and enteric drained primary deceased donor (DD) pancreas transplants, 2005-2009 and 2010-2014.

Legend: Data are given as percentages.
Table A7 shows the most common reasons for early technical pancreas graft failures. Graft loss due to graft thrombosis remains the major problem in all 3 categories. While the rate of graft thrombosis decreased in all 3 categories, the decline reached significance in SPK only. Also, the rate of early pancreatitis declined significantly in SPK (Table A7). The incidence of graft loss due to anastomotic leakage and bleeding did not change over the analyzed time in all 3 categories; it remained very low, similar to complications of procurement injuries.
A comparison of the impact of the duct management technique on technical outcome showed that the technical failure rate further declined significantly in enteric drained pancreas transplants. The technical failure rate was in general slightly lower in bladder drained transplants, but remained unchanged over time in all 3 categories. The use of enteric drainage still presented a higher risk in SPK, but not in PAK and PTA. In 2005-09, enteric drainage in SPK was associated with a significantly increased technical failure rate, but the difference was no longer statistically significant in 2010-14. In 2010-14, the technical failure rate for enteric drained SPK transplants was 5.1% compared to 3.2% for bladder-drained transplants (p = 0.18).
Table A8 (in the Appendix) shows the multivariate risk factor analysis for graft failure due to graft thrombosis. As in the univariate analysis, the reduction of graft thrombosis can be found in all 3 categories, but it reached significance in SPK only. A decrease in the risk of thrombosis with an increase in age was noted. Obesity remained a risk factor in all 3 categories, but again reached significance in SPK only. Obese SPK recipients carried a 53% higher relative risk of graft thrombosis.
Table A8. Relative Risk (RR) for early graft failure due to graft thrombosis for primary deceased donor (DD) pancreas transplants, 2005-2009 and 2010-2014.
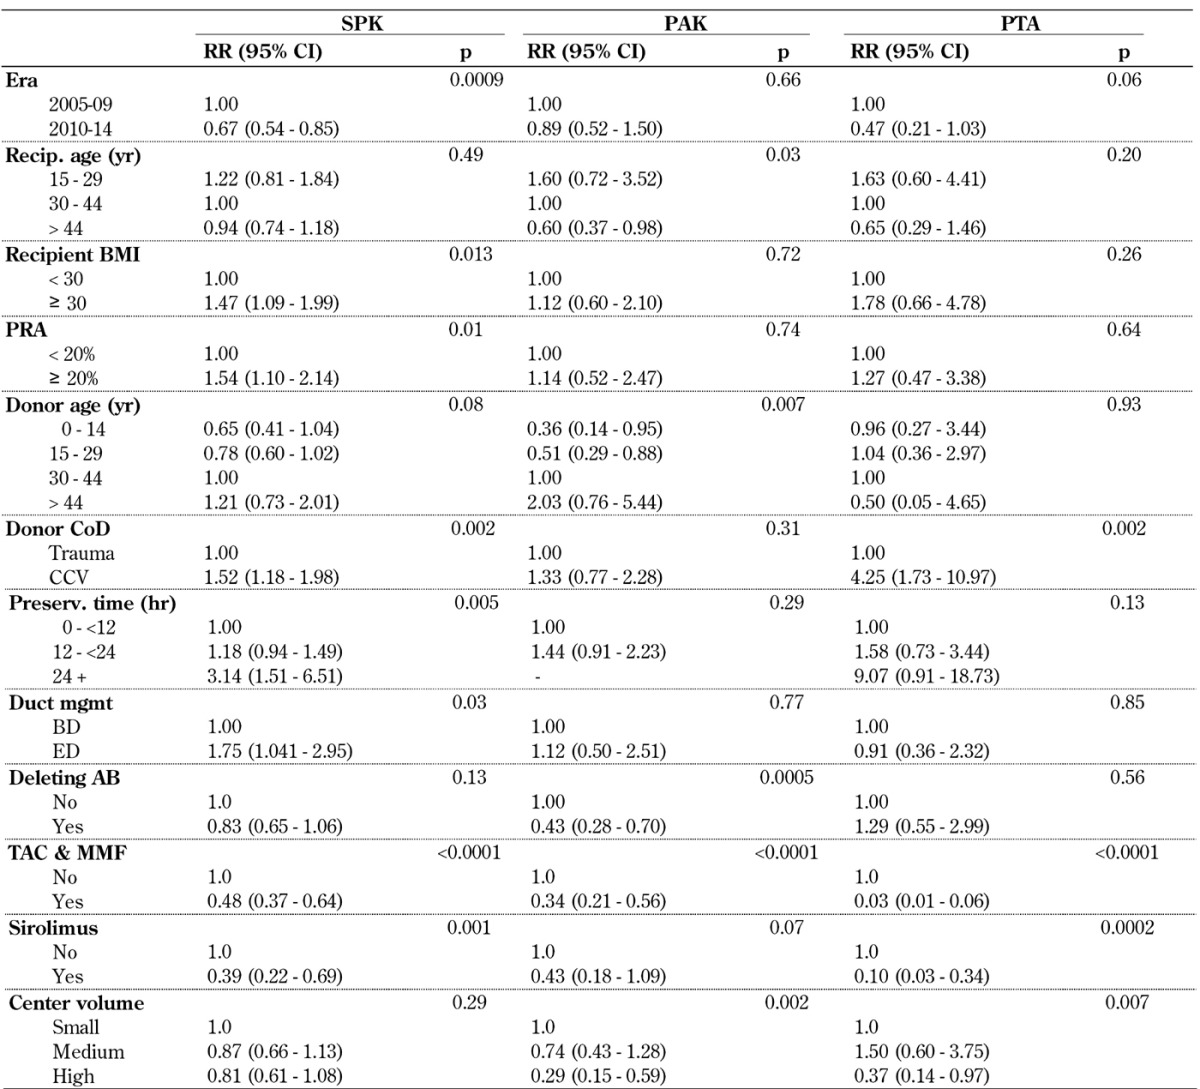
Legend: AB – antibody, BMI – body mass index, CCV – cerebro-cardiovascular, CI – confidence interval, CoD – cause of death, mgmt – management, MMF – mycophenolate mofetil, PAK – pancreas after kidney transplantation, PRA – panel reactive antibody, PreTx dialysis – dialysis prior to transplantation, PTA – pancreas transplantation alone, RR – relative risk, SPK – simultaneous pancreas kidney transplantation, Tac – tacrolimus, Tx – transplantation, WD – withdrawal.
Factors of donor quality revealed a much stronger impact in SPK recipients than in solitary transplants. Especially, donor cause of death and extended preservation time were associated with an increased risk of graft thrombosis. Solitary transplants do not have to compete for a kidney graft, and one can therefore be more selective in the choice of the donor organ. Also, solitary pancreas transplant recipients already have a functioning kidney at the time of transplant, and do not have to overcome acute tubular necrosis (ATN) of a simultaneously transplanted kidney.
Enteric drained SPK transplants showed a significantly higher risk for graft thrombosis than bladder drained SPK transplants, but no impact of duct management was found in solitary transplants.
In all 3 categories, factors which have an impact on immunological graft loss showed an effect on graft thrombosis in this model. PRA level and type of maintenance immunosuppression reached significance in SPK, maintenance immunosuppression, in solitary transplants.
In all 3 categories, the risk of graft thrombosis was lower in high versus low volume centers, but this trend was only significant for solitary transplants.
3.8 Immunological graft loss
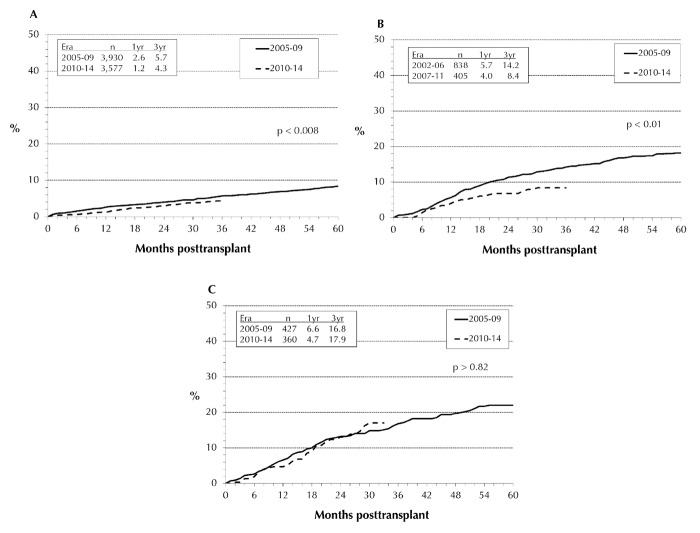
Our analysis of immunologic pancreas graft loss was limited to the first 3 years post-transplant. The differences in outcome between the 3 transplant categories were mainly due to increased rates of immunologic graft loss in PTA and PAK compared to SPK (p < 0.0001). The immunologic graft loss rate was significantly lower in the SPK pancreas than in solitary pancreas transplants. In 2010-14, the rates of immunological graft loss decreased significantly in SPK pancreas transplants (Figure 9A) from 5.7% to 4.3% at 3 years post-transplant. The same trend could be seen in PAK (Figure 9B): at 3 years post-transplant, the immunologic loss decreased from 14.2% to 8.4%. Only in PTA, no change could be detected (Figure 9C). In 2010-14, the reported immunologic 1-year graft loss rate for PAK was 4.0%, for PTA 4.7%, and for SPK 1.2%. While for the first 6 months, the immunologic graft loss rates for PAK and PTA were still comparable, at 1.4% and 1.9%, the long-term difference between the two groups became highly significant (p = 0.01). The results in the PAK category approached the excellent results in SPK.
Figure 9.
Immunological graft loss for technically successful primary deceased donor transplants, performed 2005-2009 and 2010-2014, with SPK (A), PAK (B), and PTA (C).
The immunologic loss for the SPK kidney is very low. It decreased from 0.8% to 0.6% at 1-year post-transplant (p = 0.018). At 3 years post-transplant, the immunologic kidney graft loss rate was below 3%.
The multivariate risk factor analysis confirmed a significant decrease in immunologic pancreas graft losses for SPK and PAK in 2010-14, but not for PTA (Table A9, in the Appendix). Again, a highly significant correlation between decreasing age and increasing immunologic risk was found in all 3 categories. Of special interest was the pronounced risk in PTA, where the immunological graft loss rate in younger recipients remained extremely high. Recipient and donor gender, donor cause of death, and sensitization of the recipients did not have a significant impact, but older donor age carried a significantly higher RR of graft loss in SPK transplant. HLA-A and -B mismatching did not impact the immunologic risk in all 3 categories. Only a full HLA-DR mismatch resulted in a significantly higher risk of SPK. The effect of HLA mismatching did not reach significance in PTA.
Table A9. Relative risk (RR) for immunological pancreas graft loss in technically successful primary deceased donor (DD) pancreas transplants, 2005-2009 and 2010-2014.
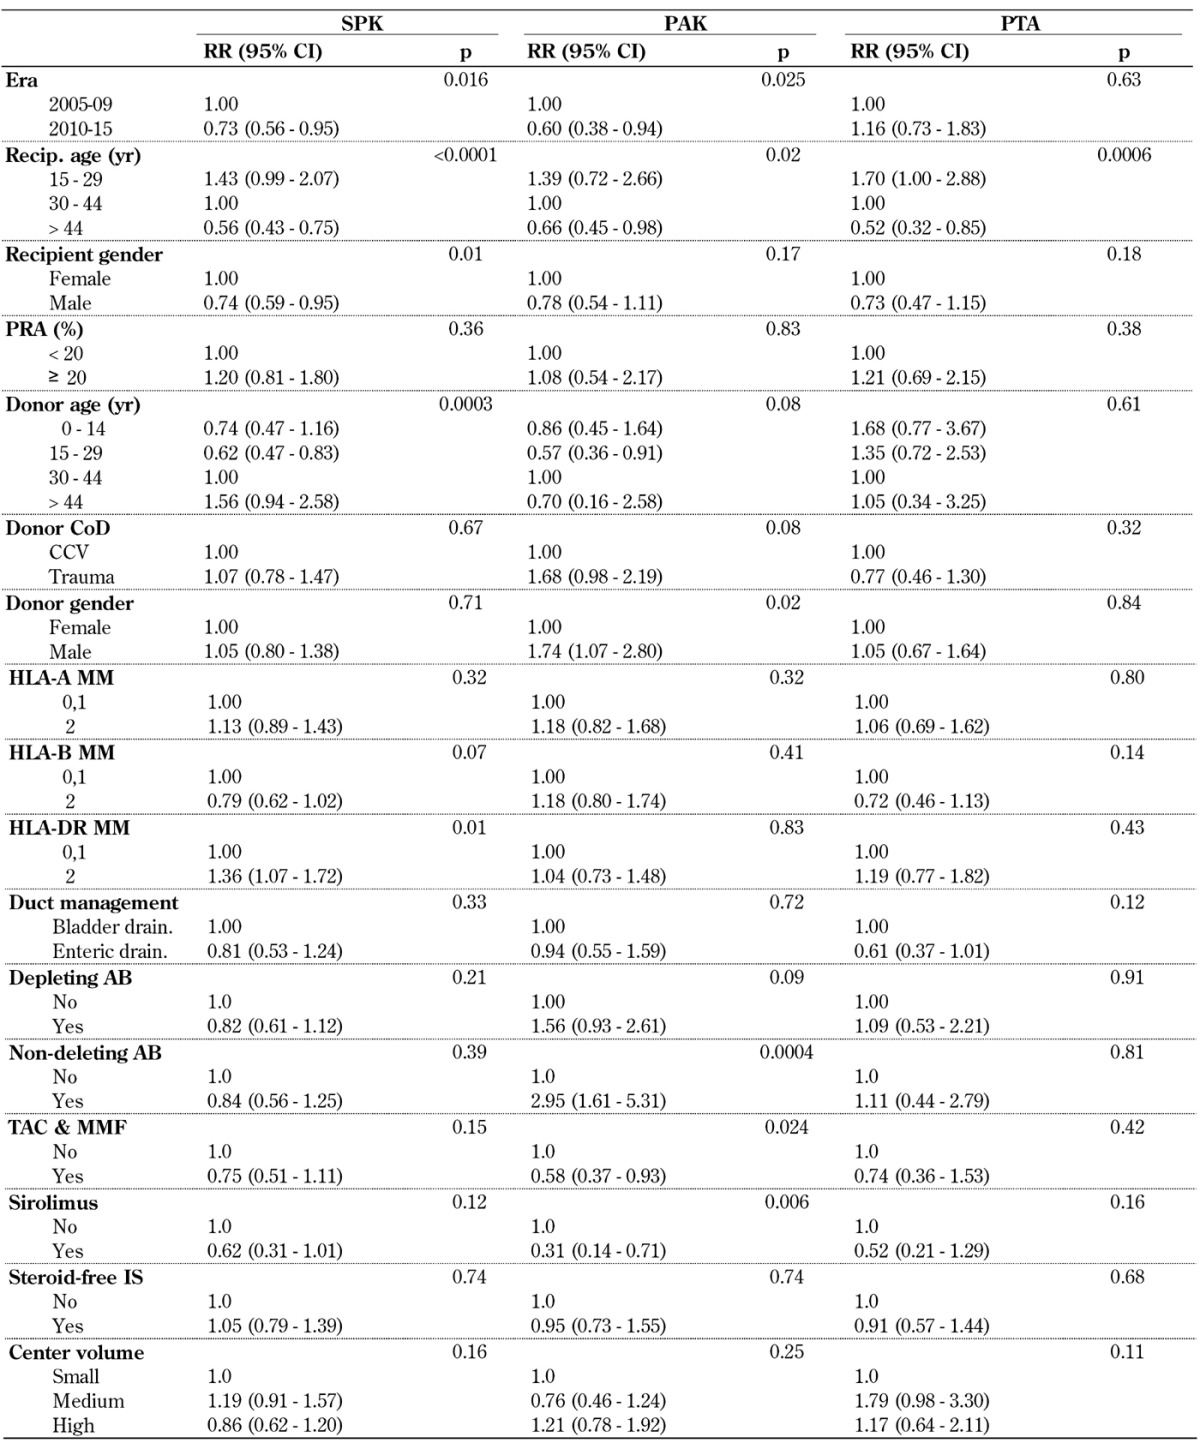
Legend: AB – antibody, CCV – cerebro-cardiovascular, CI – confidence interval, CoD – cause of death, HLA – human leukocyte antigen, IS – immunosuppression, MMF – mycophenolate mofetil, PAK – pancreas after kidney transplantation, PRA – panel reactive antibody, PTA – pancreas transplantation alone, RR – relative risk, SPK – simultaneous pancreas kidney transplantation, Tac – tacrolimus.
In our analysis, enteric drainage was associated with a lower RR in all 3 categories, but this result did not reach significance.
The use of non-depleting antibodies for induction therapy did not reach significance in SPK, but showed a negative effect in solitary transplants. The maintenance protocol of TAC in combination with MMF- and sirolimus-based protocols achieved excellent outcomes in all 3 categories. The use of a steroid-free protocol did not show a significant impact on outcome. Center volume did not influence the risk of immunologic graft loss in any of the 3 categories.
4. Results of non-US transplants
As shown in Figure 1, the number of pancreas transplants outside the US started to increase around 10 years later than in the US. But in contrast to the US, the number of transplants kept increasing, and new programs have been started in many countries. Table A10 (in the Appendix) shows the newest developments in pancreas transplant by continent/region over the last decade.
Table A10. Number of pancreas transplants by continent/region, 2005-2009 and 2010-2014.
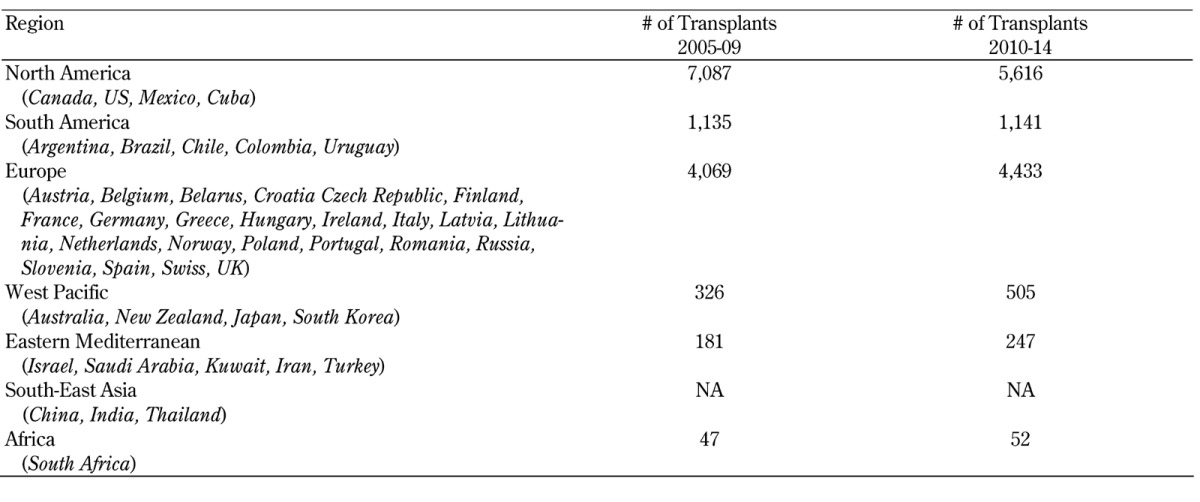
North America is still leading, with the highest number of pancreas transplants, but the number of transplants declined overall by 21% during 2010-14. This decline was due to significantly fewer transplants in the US and Canada. There were only very few transplants performed in Mexico and Cuba.
Next to the US, Europe reported the most pancreas transplants. The overall number of pancreas transplants in Europe further increased by 9% in 2010-14. While the transplant numbers of most European countries remained stable, the Scandinavian countries Sweden, Norway, and Finland showed a significant increase in pancreas transplants. The United Kingdom, Portugal, Poland, and the Czech Republic also recorded an increase in pancreas transplants over the last decade, but in Austria, Italy and Belgium a significant decrease was recorded.
After the initial strong growth of transplants in South America, no further expansion was noted. While the programs in Argentina were further growing, the numbers in Brazil went slightly down. In Chile, Peru, Colombia, and Uruguay, few pancreas transplants were performed.
An increase in pancreas transplants was also seen in the West-Pacific region, with Japan and South Korea recording the highest increase. The numbers of pancreas transplants in Australia remained stable. In New Zealand, between 1 and 3 pancreas transplants were performed per year only.
In the Eastern Mediterranean region, the transplant activity is slowly increasing. Most of the reported pancreas transplants came from Iran which recorded between 20 and 30 pancreas transplants per year. The number of pancreas transplants in Israel remained stable over the last decade, while the number in Turkey decreased.
Pancreas transplants in Africa were performed in South Africa only. The number of transplants remained stable, with about 10 transplants per year.
Only very incomplete information was available for the South-East Asia region, preventing a comprehensive analysis. In Taiwan, around 10 pancreas transplants were performed per year.
Figure 10 shows the number of pancreas transplants per country in relation to the number of population in 2013. In Scandinavia, the highest rates of pancreas transplants were recorded in Norway and Sweden, and to a lesser degree in Finland, indicating excellent access for the respective populations. The number of transplants in relation to the size of the population was also very high in the United Kingdom. The US, when adjusted for population size, was ranked 5th.
Figure 10.
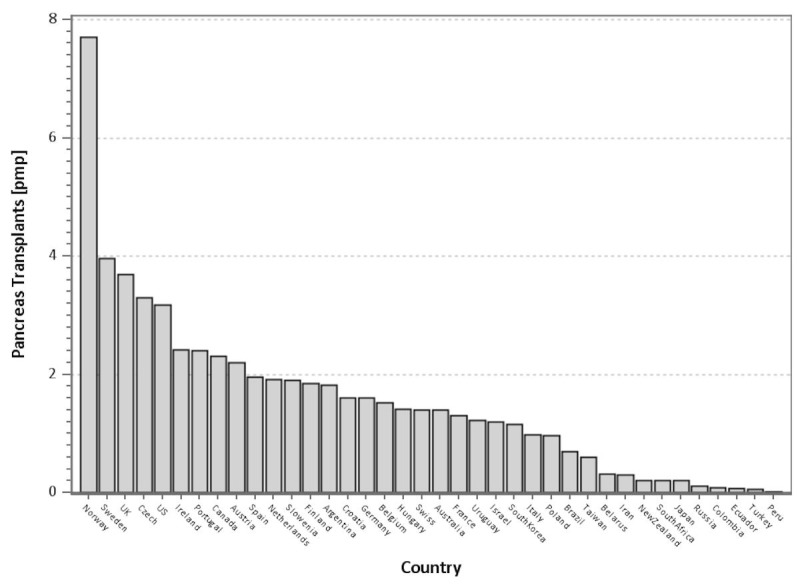
Number of pancreas transplants per million population by country in 2013.
While the rates of solitary pancreas transplants were reported to be around 20% in the US, they were significantly lower outside the US. There, the majority of pancreas transplants were performed in combination with a simultaneous kidney graft. In most countries, the rates of solitary transplants account for less than 10% of all pancreas transplants.
Since the reporting for non-US transplants was not complete at the time of analysis, we have not published outcome results in this report. An initial analysis of the reported data showed comparable patient and graft survival rates.
5. Discussion
A plethora of literature exists by now demonstrating that whole organ pancreas transplantation is the best short- and long-term treatment option for patients with labile insulin-dependent diabetes mellitus for achieving good metabolic control and avoiding or ameliorating secondary complications of diabetes [2-4]. Yet, despite significant and ongoing improvements in outcome, the number of pancreas transplants in the US surprisingly continued to decline. This decline was most pronounced in the PAK category, in which, of all categories, the results had improved the most. In the 2010-14 era, 16 US transplant centers stopped performing PAK transplants, while the number of centers performing SPK transplants and PTAs remained stable.
However, this US-specific trend is balanced by a significant increase in the number of pancreas transplants outside of the US, primarily in Europe and Asia. Of particular interest is the current development in the United Kingdom. It has one of the highest pancreas transplant rates per population in the world, despite the fact that pancreas and islet transplant candidates are placed on the same waitlist, and compete for the same organ [5]. Because outcome data for non-US cases were not complete at the time of analysis, survival data were presented in this report for US cases only.
This IPTR analysis not only confirmed the results of previous registry reports, but also showed new or refined findings. In the US, the time on the waitlist for an SPK transplant, even with the recent changes in organ allocation, was significantly longer than for a solitary pancreas transplant. The SPK transplant waiting time remained associated with a significantly higher mortality risk and rate than for solitary pancreas transplant candidates without end-stage renal disease (ESRD). Also, the surgical risk of the dual transplant remained higher than its post-transplant mortality, the latter in part because of the advanced secondary diabetic complications.
Therefore, a solitary pancreas transplant should be considered early in the life of a brittle diabetic patient and before the development of ESRD [6, 7]. However, there is reluctance to recommend a solitary pancreas transplant before the development of secondary complications because many physicians still believe that exogenous insulin administration outweighs the surgical risks and the risk of post-transplant immunosuppression. But the facts are in favor of pancreas transplantation: 1-year patient survival is >95% and graft survival is at 80%, all achieved in conjunction with normoglycemia and absence of wide glucose oscillations, including hypoglycemic episodes and hypoglycemic unawareness. With the improvement in patient management and surgical techniques, life-threatening infections due to immunosuppression and technical failures have become very rare, and compare very favorably with the morbidity and mortality of non-transplanted brittle diabetics [7-9].
If ESRD has already developed, and a living kidney donor is available, the possibility of a PAK transplant should be discussed with the patient to prevent dialysis or significantly shorten the time on dialysis. Time on dialysis does not only increase mortality on the waitlist, but also post-transplant.
The most important reasons for the improved patient and graft survival in the most recent 2010-14 era were:
Over the last decade, the recipients in all 3 categories were older, and therefore had a lower immunologic risk of graft loss.
In the PTA category, a significant decrease for an additional kidney transplant was noted, and in the PAK category, the function of the previously transplanted kidneys improved. The same trend was noted in SPK kidney function. In all 3 categories, the improved kidney function was most likely the result of refinements in immunosuppression.
Better selection of pancreas donors. The trend was clearly towards younger and healthier donors.
With the decrease in overall pancreas transplant numbers, not only a change to younger and better pancreas donors was observed, but also a trend towards risk minimization. This is also reflected by the fact that the average preservation time decreased significantly in all 3 categories.
Enteric drainage is now used in over 80% of all pancreas transplants, and no overall negative effects of this technique were found. Technical complications seem to be slightly higher in enteric drained transplants only. Drainage of the donor venous system into the recipient portal vein further declined, and was used in less than 20% of all enterically drained transplants.
TAC in combination with MMF and antibody induction therapy was the most widely used protocol, providing excellent results. Induction therapy was given in the vast majority of transplants.
The use of steroid-free maintenance protocols increased. However, while no negative effect on pancreas outcome was noted, there seems to be an increased relative risk for long-term kidney graft loss in SPK.
Late immunologic graft loss rates showed a lower frequency in SPK than in solitary transplants, but the difference in long-term outcome, especially between PAK and SPK, was small.
While some risk factors became less important during the reporting periods (such as duct management, technique, or preservation time), others gained in importance (age at transplant, center volume). The rate of African American and Hispanic recipients increased significantly, particularly in the SPK category; their transplant results were similar to that in white recipients. The rate of type 2 diabetes as reason for SPK transplants increased significantly in 2010-14. With the decline in overall numbers of pancreas transplants, we also noted a decline in the number of transplants within centers. The overall number of centers remained somewhat stable but, as mentioned, the number of transplants per center declined.
There is a broad geographic variation in the incidence of type 1 diabetes. The predominance of pancreas transplantation in the US and Europe remained, primarily because of the increased frequency of type 1 diabetes in these continents [10]. Particularly in Scandinavian countries, the rate of type 1 diabetes is very high, which also explains the high rate of pancreas transplants in these countries. In contrast, in many African and Asian countries, the risk of type 1 diabetes is much lower, and therefore pancreas transplant has not yet been introduced.
Type 2 diabetes is rapidly increasing all over the world. It will be seen if pancreas transplantation will become a more frequent procedure in type 2 diabetes in the future.
Since outcome reporting is not obligatory outside the US, exact graft survival rates in various parts of the world remain somewhat unclear. For those that were reported, the outcome results were remarkably similar to those in the US.
Appendix
Acknowledgments
Disclosures
The authors report no conflict of interests.
References
- 1.Gruessner RW, Gruessner AC. The current state of pancreas transplantation. Nat Rev Endocrinol. 2013;9(9):555–562. doi: 10.1038/nrendo.2013.138. [DOI] [PubMed] [Google Scholar]
- 2.Boggi U, Rosati CM, Marchetti P. Follow-up of secondary diabetic complications after pancreas transplantation. Curr Opin Organ Transplant. 2013;18(1):102–110. doi: 10.1097/MOT.0b013e32835c28c5. [DOI] [PubMed] [Google Scholar]
- 3.Khairoun M, de Koning EJ, van den Berg BM, Lievers E, de Boer HC, Schaapherder AF, Mallat MJ, Rotmans JI, van der Boog PJ, van Zonneveld AJ. et al. Microvascular damage in type 1 diabetic patients is reversed in the first year after simulataneous pancreas-kidney transplantation. Am J Transplant. 2013;13(5):1272–1281. doi: 10.1111/ajt.12182. [DOI] [PubMed] [Google Scholar]
- 4.Bijkerk R, Duijs JM, Khairoun M, Ter Horst CJ, van der Pol P, Mallat MJ, Rotmans JI, de Vries AP, de Koning EJ, de Fijter JW. et al. Circulating microRNAs associate with diabetic nephropathy and systemic microvascular damage and normalize after simultaneous pancreas-kidney transplantation. Am J Transplant. 2015;15(4):1081–1090. doi: 10.1111/ajt.13072. [DOI] [PubMed] [Google Scholar]
- 5.Hudson A, Bradbury L, Johnson R, Fuggle SV, Shaw JA, Casey JJ, Friend PJ, Watson CJ. The UK pancreas allocation scheme for whole organ and islet transplantation. Am J Transplant. 2015;15(9):2443–2455. doi: 10.1111/ajt.13284. [DOI] [PubMed] [Google Scholar]
- 6.Gruessner RW, Gurssner AC. Pancreas transplants alone: a procedure coming of age. Diabetes Care. 2013;36(8):2440–2447. doi: 10.2337/dc12-2195. [DOI] [PMC free article] [PubMed] [Google Scholar]
- 7.Niederhaus SV. Pancreas transplant alone. Curr Opin Organ Transplant. 2015;20(1):115–120. doi: 10.1097/MOT.0000000000000157. [DOI] [PubMed] [Google Scholar]
- 8.Fridell JM, Mangus RS, Hollinger EF, Taber TE, Goble ML, Mohler E, Milgrom ML, Powelson JA. The case for pancreas after kidney transplantation. Clin Transplant. 2009;23(4):447–453. doi: 10.1111/j.1399-0012.2009.00996.x. [DOI] [PubMed] [Google Scholar]
- 9.Kaufman D. Pancreas-after-kideny transplantation: to have and not have not. Clin Transplant. 2009;23(4):435–436. doi: 10.1111/j.1399-0012.2009.01032.x. [DOI] [PubMed] [Google Scholar]
- 10.Karvonen MV, Viik-Kajander M, Moltchanova E, Libman I, LaPorte R, Tuomilehto J. Incidence of childhood type 1 diabetes worldwide. Diabetes Care. 2000;23(10):1516–1526. doi: 10.2337/diacare.23.10.1516. [DOI] [PubMed] [Google Scholar]


